Is There a More Important Chart Than DXY Right Now?
By Steve Strazza
October 1, 2024
With stock market investors looking every which way at different market-moving headlines today, let's take a step back and talk about what's really important.
We just got monthly candles. It's time to zoom out.
And when we do, is there a chart more important than the US Dollar Index $DXY right now?
The dollar has had a very strong inverse correlation with stocks and other risk assets for several years now.
Equities have done well for the past two years while the dollar has been rangebound.
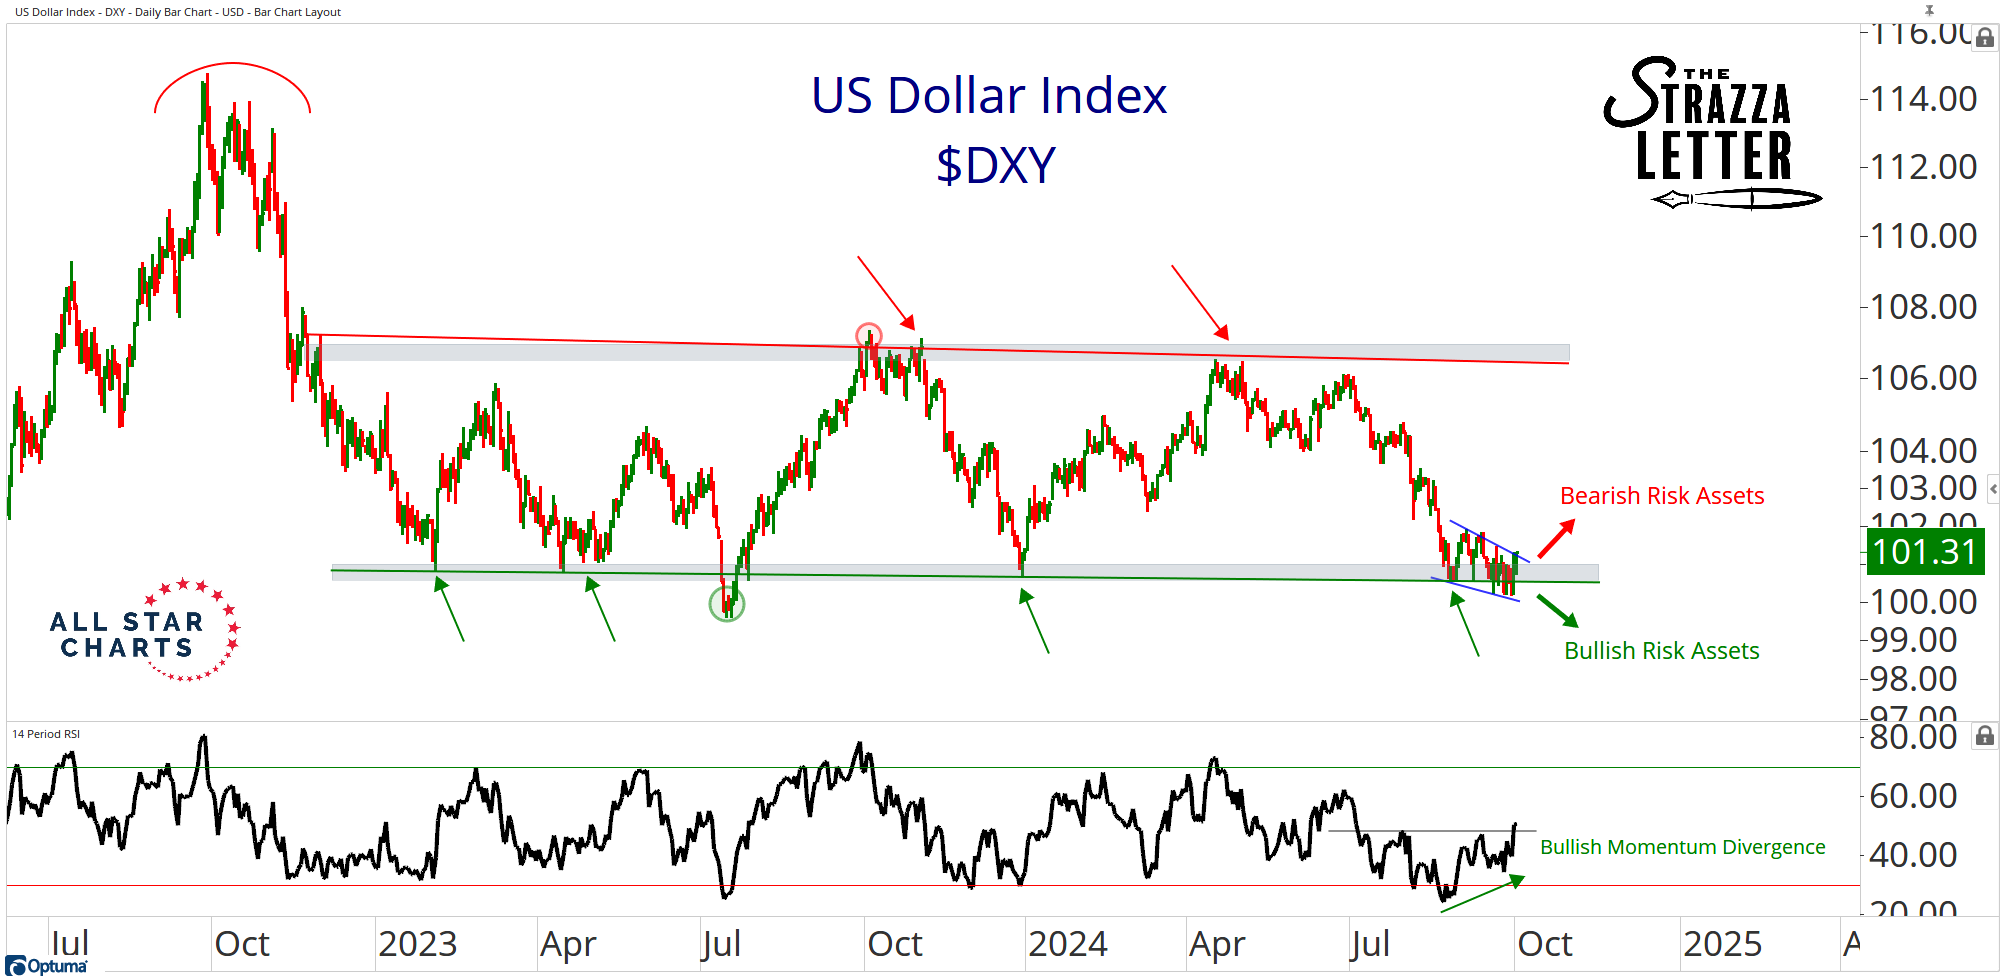
Just imagine how they'll do if DXY breaks down from its current range:
This is the question investors should be asking themselves right now.
Instead of worrying about the war in the Middle East or the longshoremen and dockworkers striking…
The real question that matters for all our portfolios, not just today but over longer timeframes, is whetherDXY digs in at this support level or breaks down.
If it's the former, look for today's corrective action to have some legs.
If it's the latter, we should be buying this dip aggressively.
Last week, we suggested DXY was likely to break down. The thesis was based on weak dollar internals and the principle of polarity.
Maybe it's eventually the case, but it has yet to happen. In fact, things are moving in the opposite direction.
Let's discuss two crucial data points that suggest DXY digging in and rebounding off support.
The first one is momentum divergence, as marked up in the above chart.
Not only did we have a higher low in momentum as the price made fresh 52-week lows last week, but we didn't even come close to oversold territory.
With today's little rally, momentum is surging to its highest level since early July. The last time the RSI-14 was this high, DXY was at the upper bounds of this range… not the bottom of it.
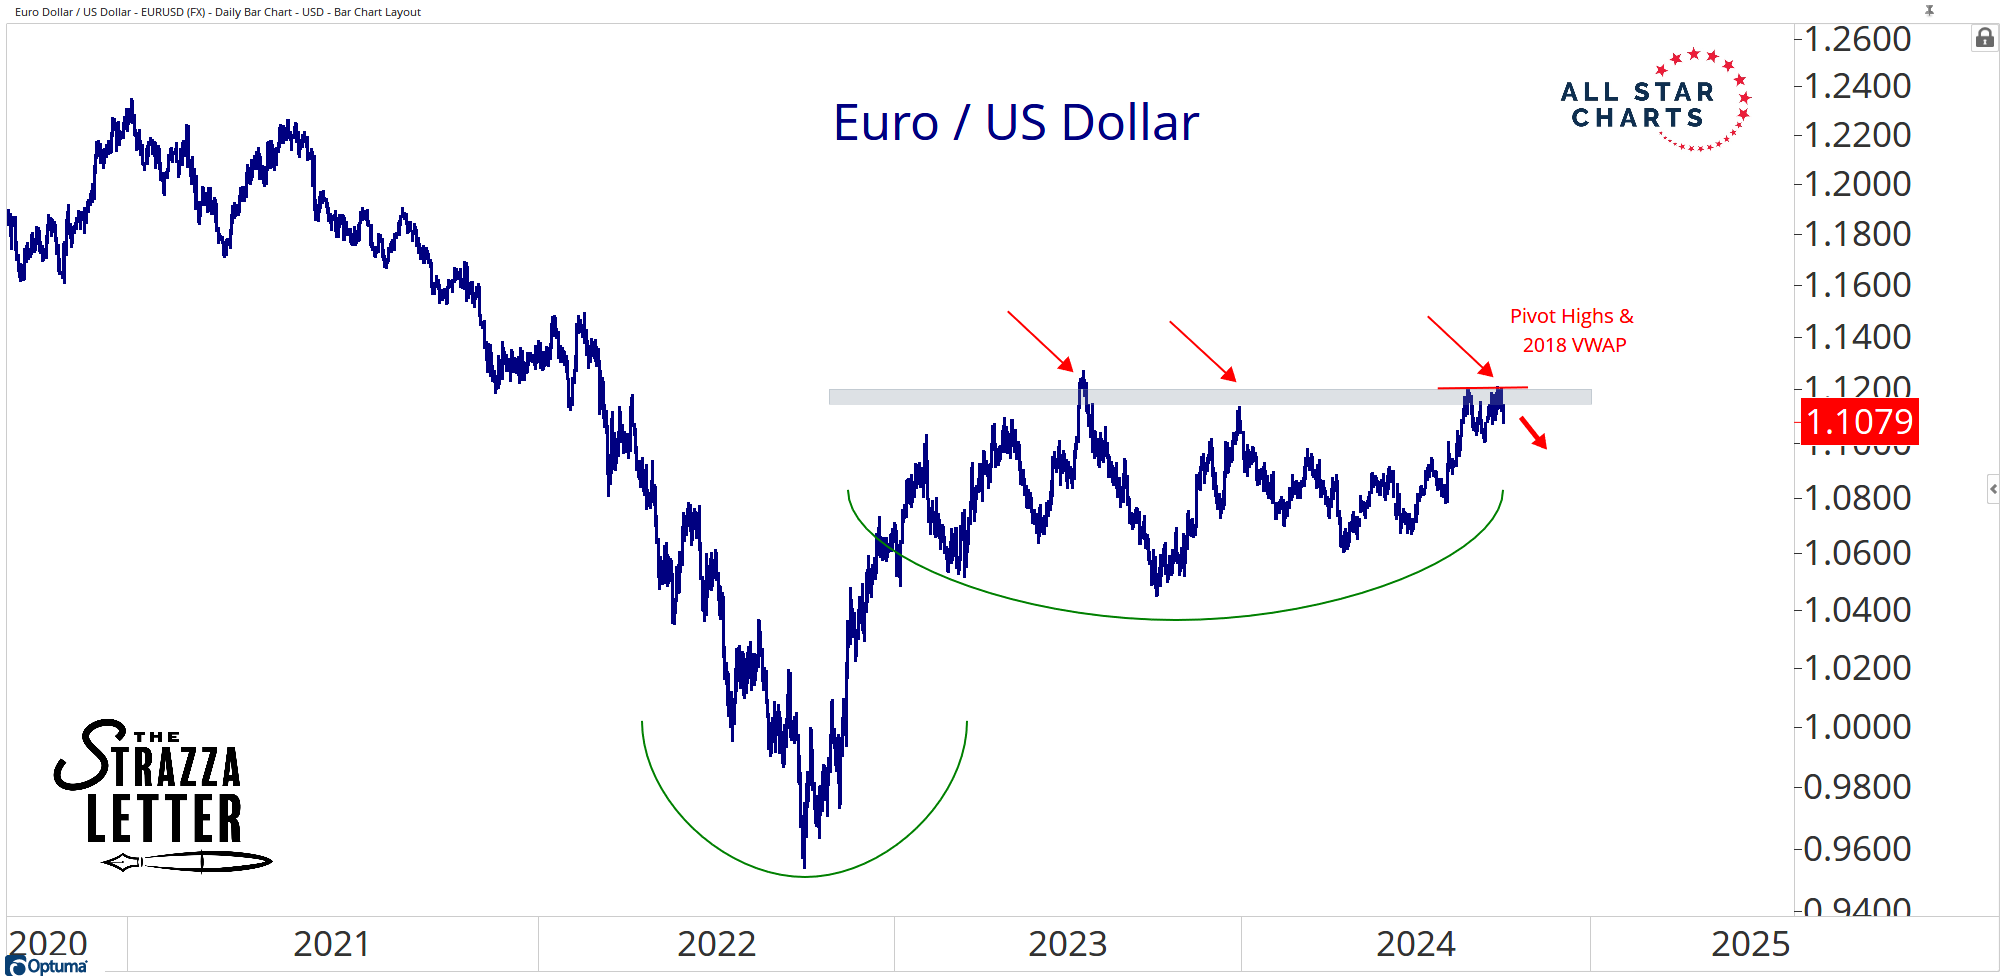
And the next point matters more than anything for the DXY Index. Here's the EUR/USD failing to complete a reversal pattern.
Euro makes up almost 60% of DXY. Think of this index as short the euro and then some other things. The bottom line is that DXY will resolve lower if and when EUR resolves higher.
For now, the price action suggests these resolutions will take some time. The euro is failing right at the upper bounds of its range.
It's not shown on the chart, but the pivot highs coincide almost perfectly with the VWAP from the 2018 highs around 1.12. That's the line in the sand for EUR.
I still think an upside breakout for EUR and a downside resolution for DXY will come, but not now.
Unfortunately, we can't give a full green light to equities and other risk assets until this happens.
We're set up perfectly for a big year-end rally. Let's see that confirmation from DXY before we get too excited about it. Look for the euro to be the tell.