Support zones are holding and bears are struggling to take control at key levels.
We’re seeing it with both short and longer term patterns and we’re seeing it across all areas of the market. Bulls keep digging in where they need to.
So I came across this pattern in Nike and thought why not.
Make no mistake this is a purely technical call… for the most part.
I mean, seriously. Nike is one of the all-time great American brands. That still counts for something.
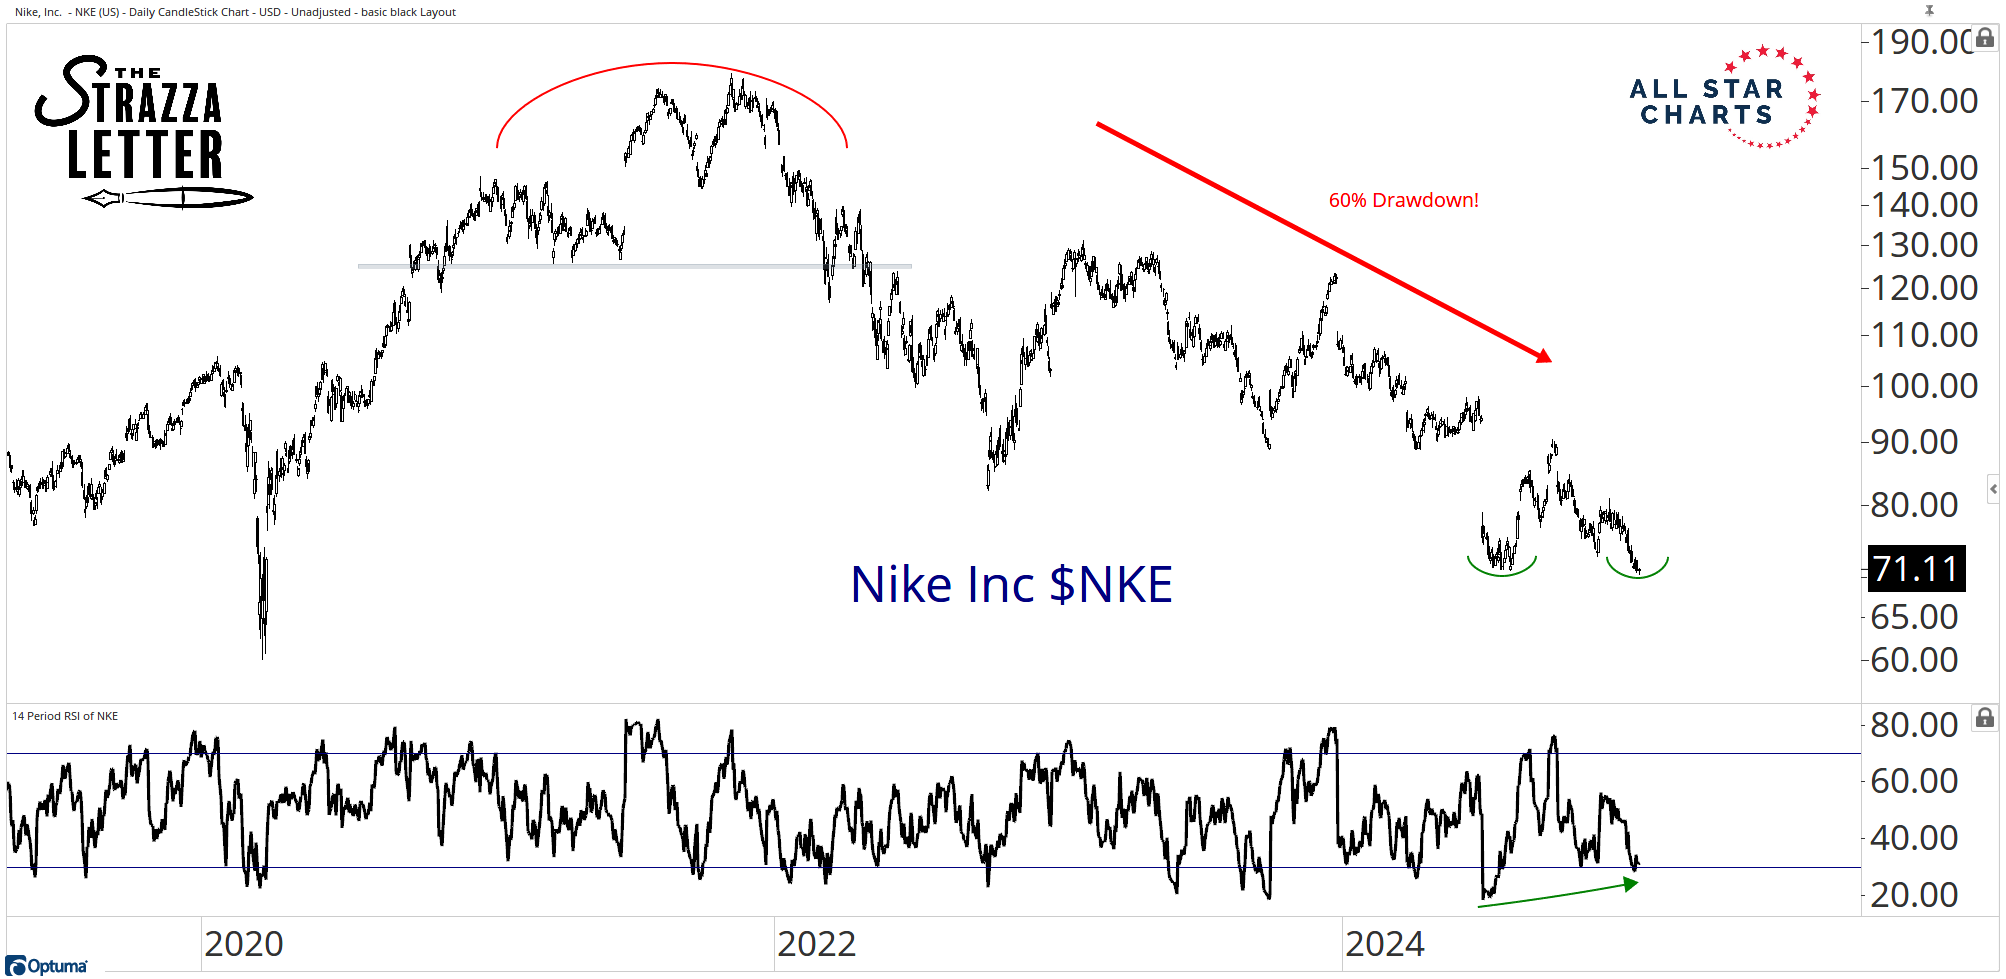
The stock is in a 60% drawdown. It has been destroyed. Is it going to zero!?
I think it has to be a buy eventually. It’s just a matter of when.
The sentiment around this name is just terrible right now. When I told the guys on the analyst team what I was thinking, I was told “gross bro. Nobody wears Nike anymore.” And he's right, it’s true! I still like Nike, but I wouldn't wear it on the golf course.
The thing is I don't know what else could go wrong for them at this point. The fact they are getting their butts kicked by smaller brands in just about every category is not a secret. It's why this chart looks the way it does.
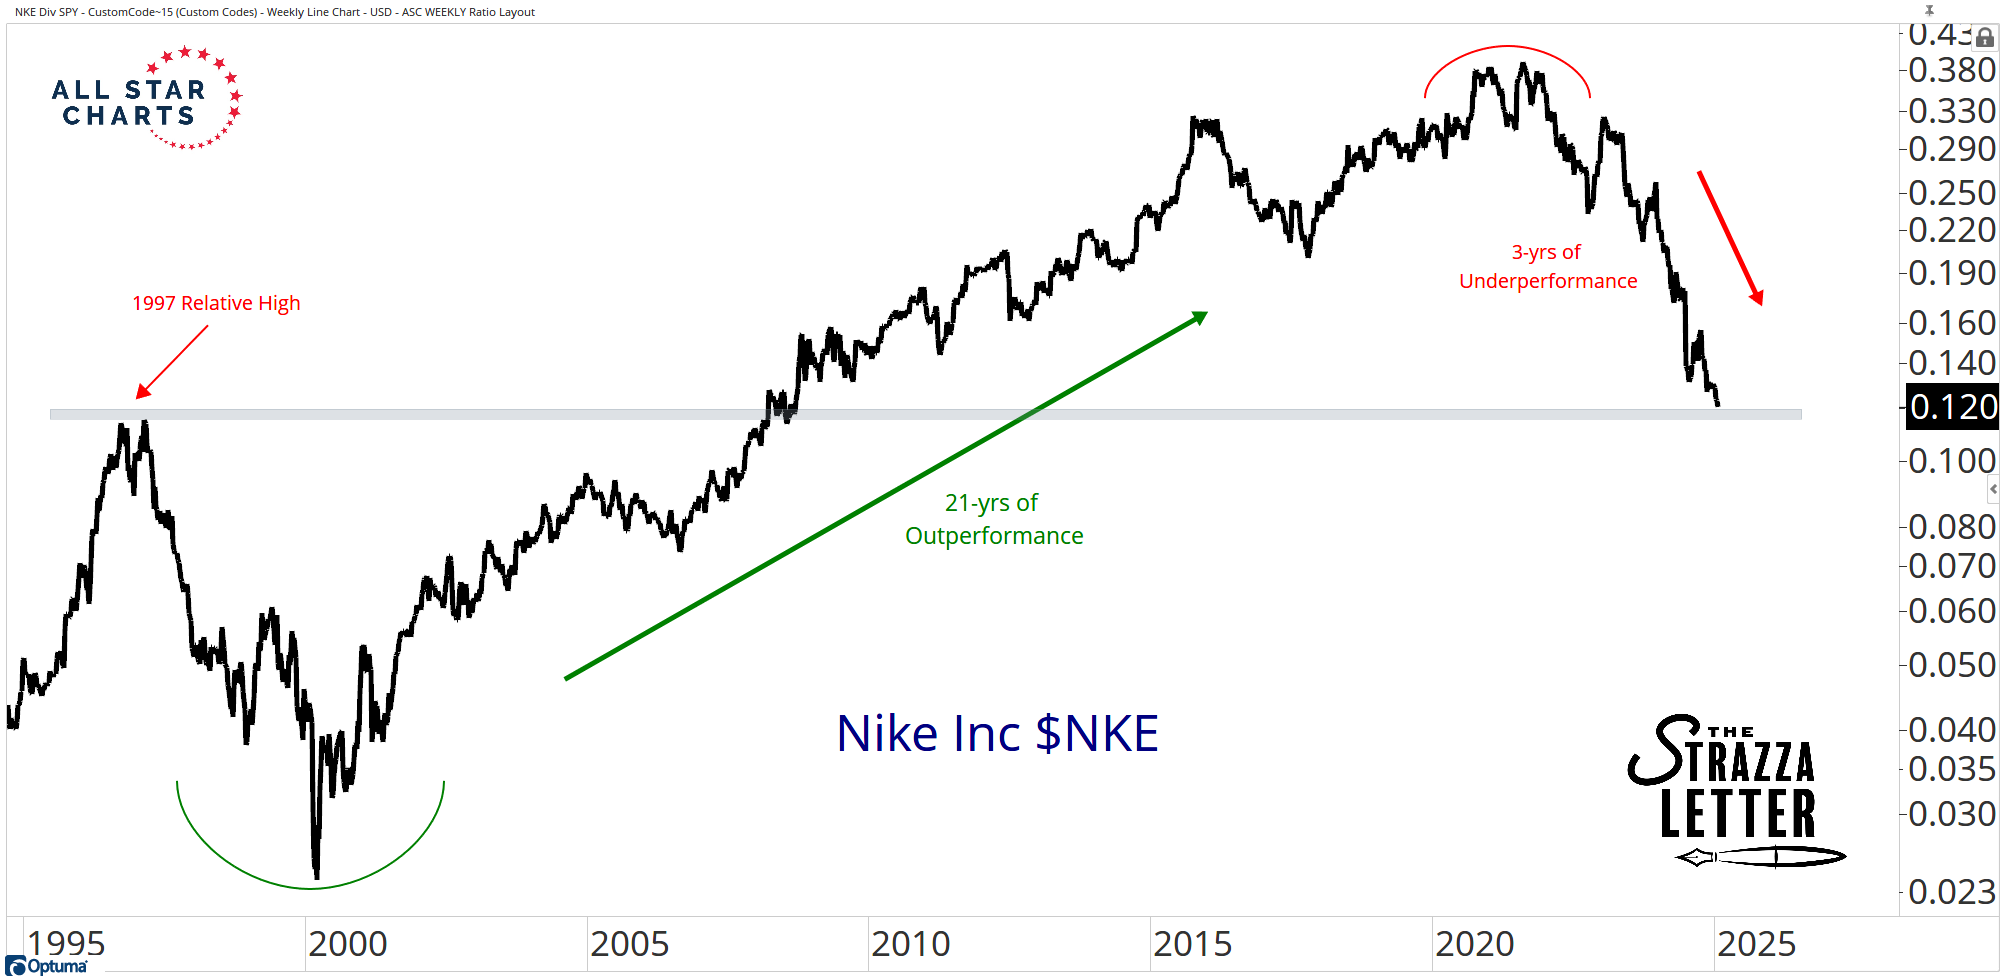
The stock has underperformed so badly in recent years that it is all the way back to its 1997 highs versus the S&P 500.
That means over the course of the last 28 years, Nike has gone absolutely nowhere relative to the broader market. Zero alpha. In-line performance.
I don't think this will be the case over the next few decades though. Nike is one of the dominant global apparel retailers.
I think it's only a matter of time before they figure it out and turn things around.
The Nike story reminds me a lot of Disney from last year. They were the last great American brand in a 60% drawdown. This year, the stock looks to be embarking on a new uptrend.
My point is, they bounced back. The greats usually do. And I think Nike will do the same over the coming months and quarters.
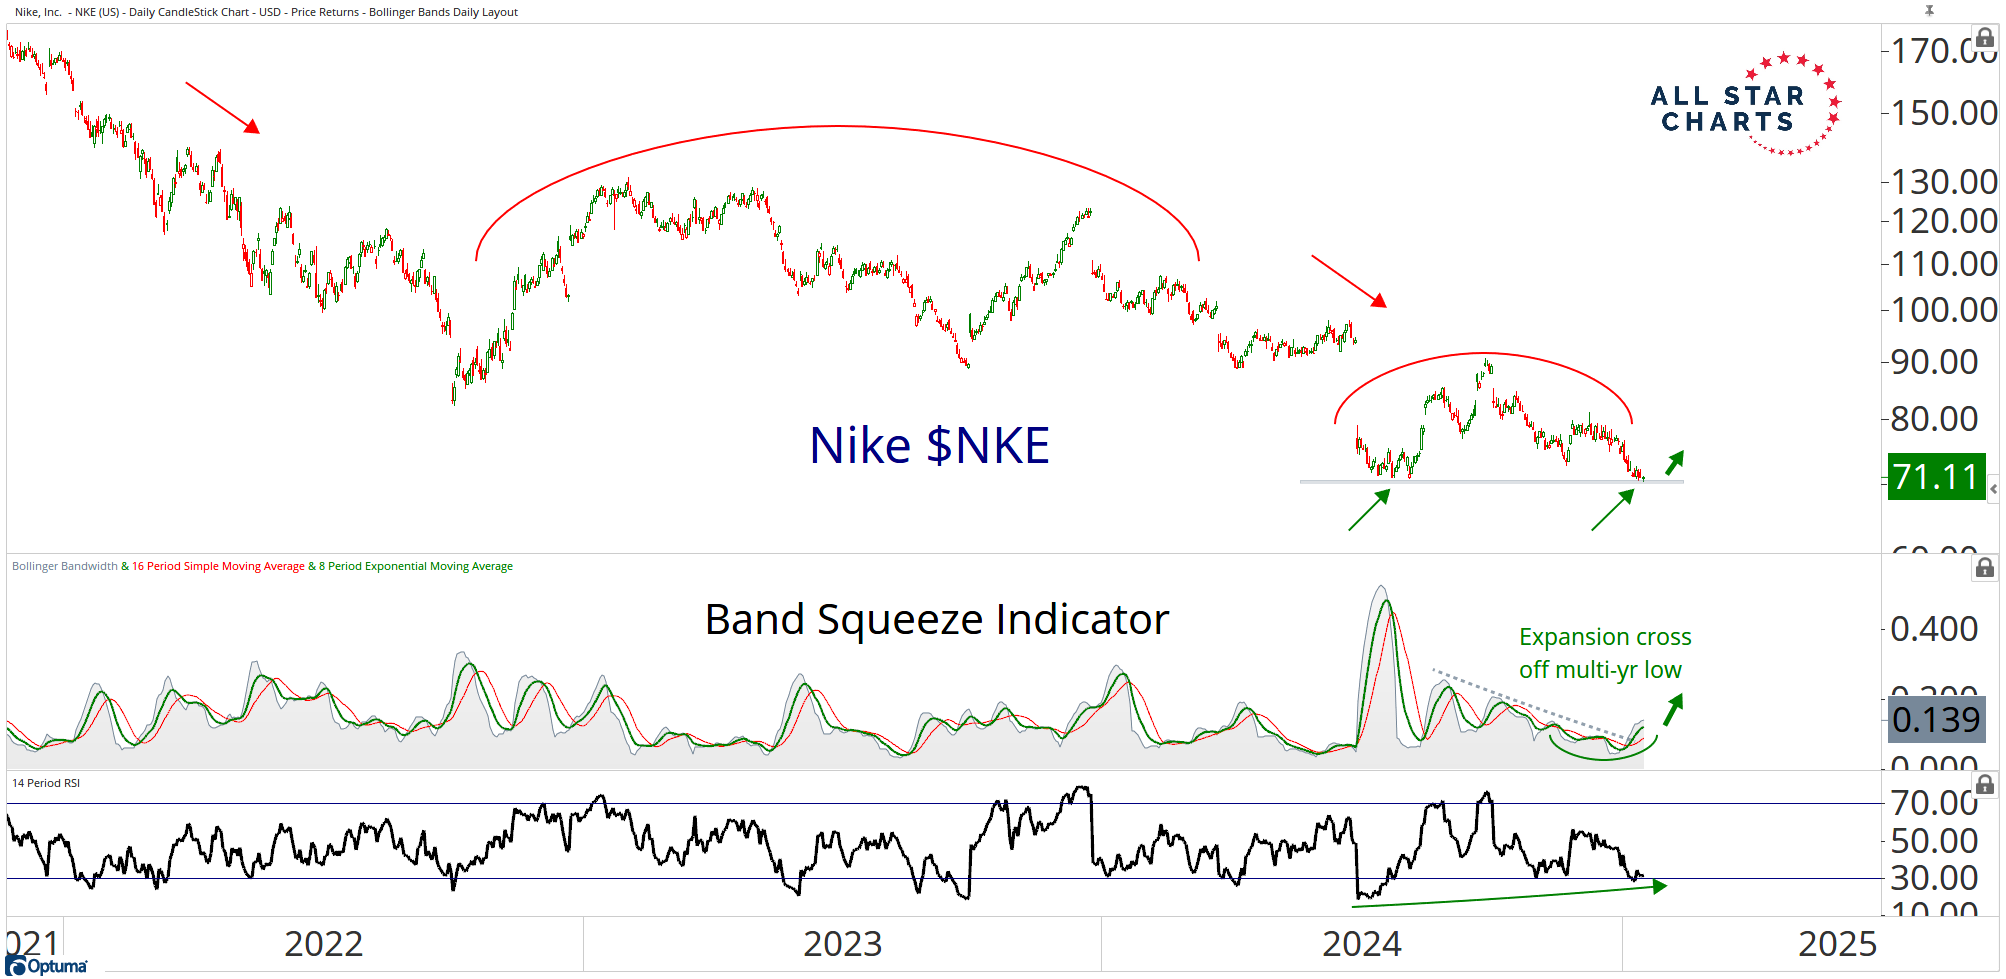
I’m buying some shares for my long-term account with a tight stop a couple percent beneath these lows.
I like the potential momentum divergence and I like how the band squeeze indicator is signaling volatility expansion. If price can hold this key support level, I think that expansion comes in the form of upside momentum. And it should happen soon.
This is a good candidate for Breakout Multiplier. If it starts moving in the right direction, we'll look to put a trade on in the coming weeks.