Interactive Brokers (IBKR) is a leading online brokerage firm that provides advanced trading platforms and comprehensive brokerage services to individual and institutional investors. With a focus on low-cost trading and advanced technology, Interactive Brokers offers a wide range of financial products, including stocks, options, futures, and forex.
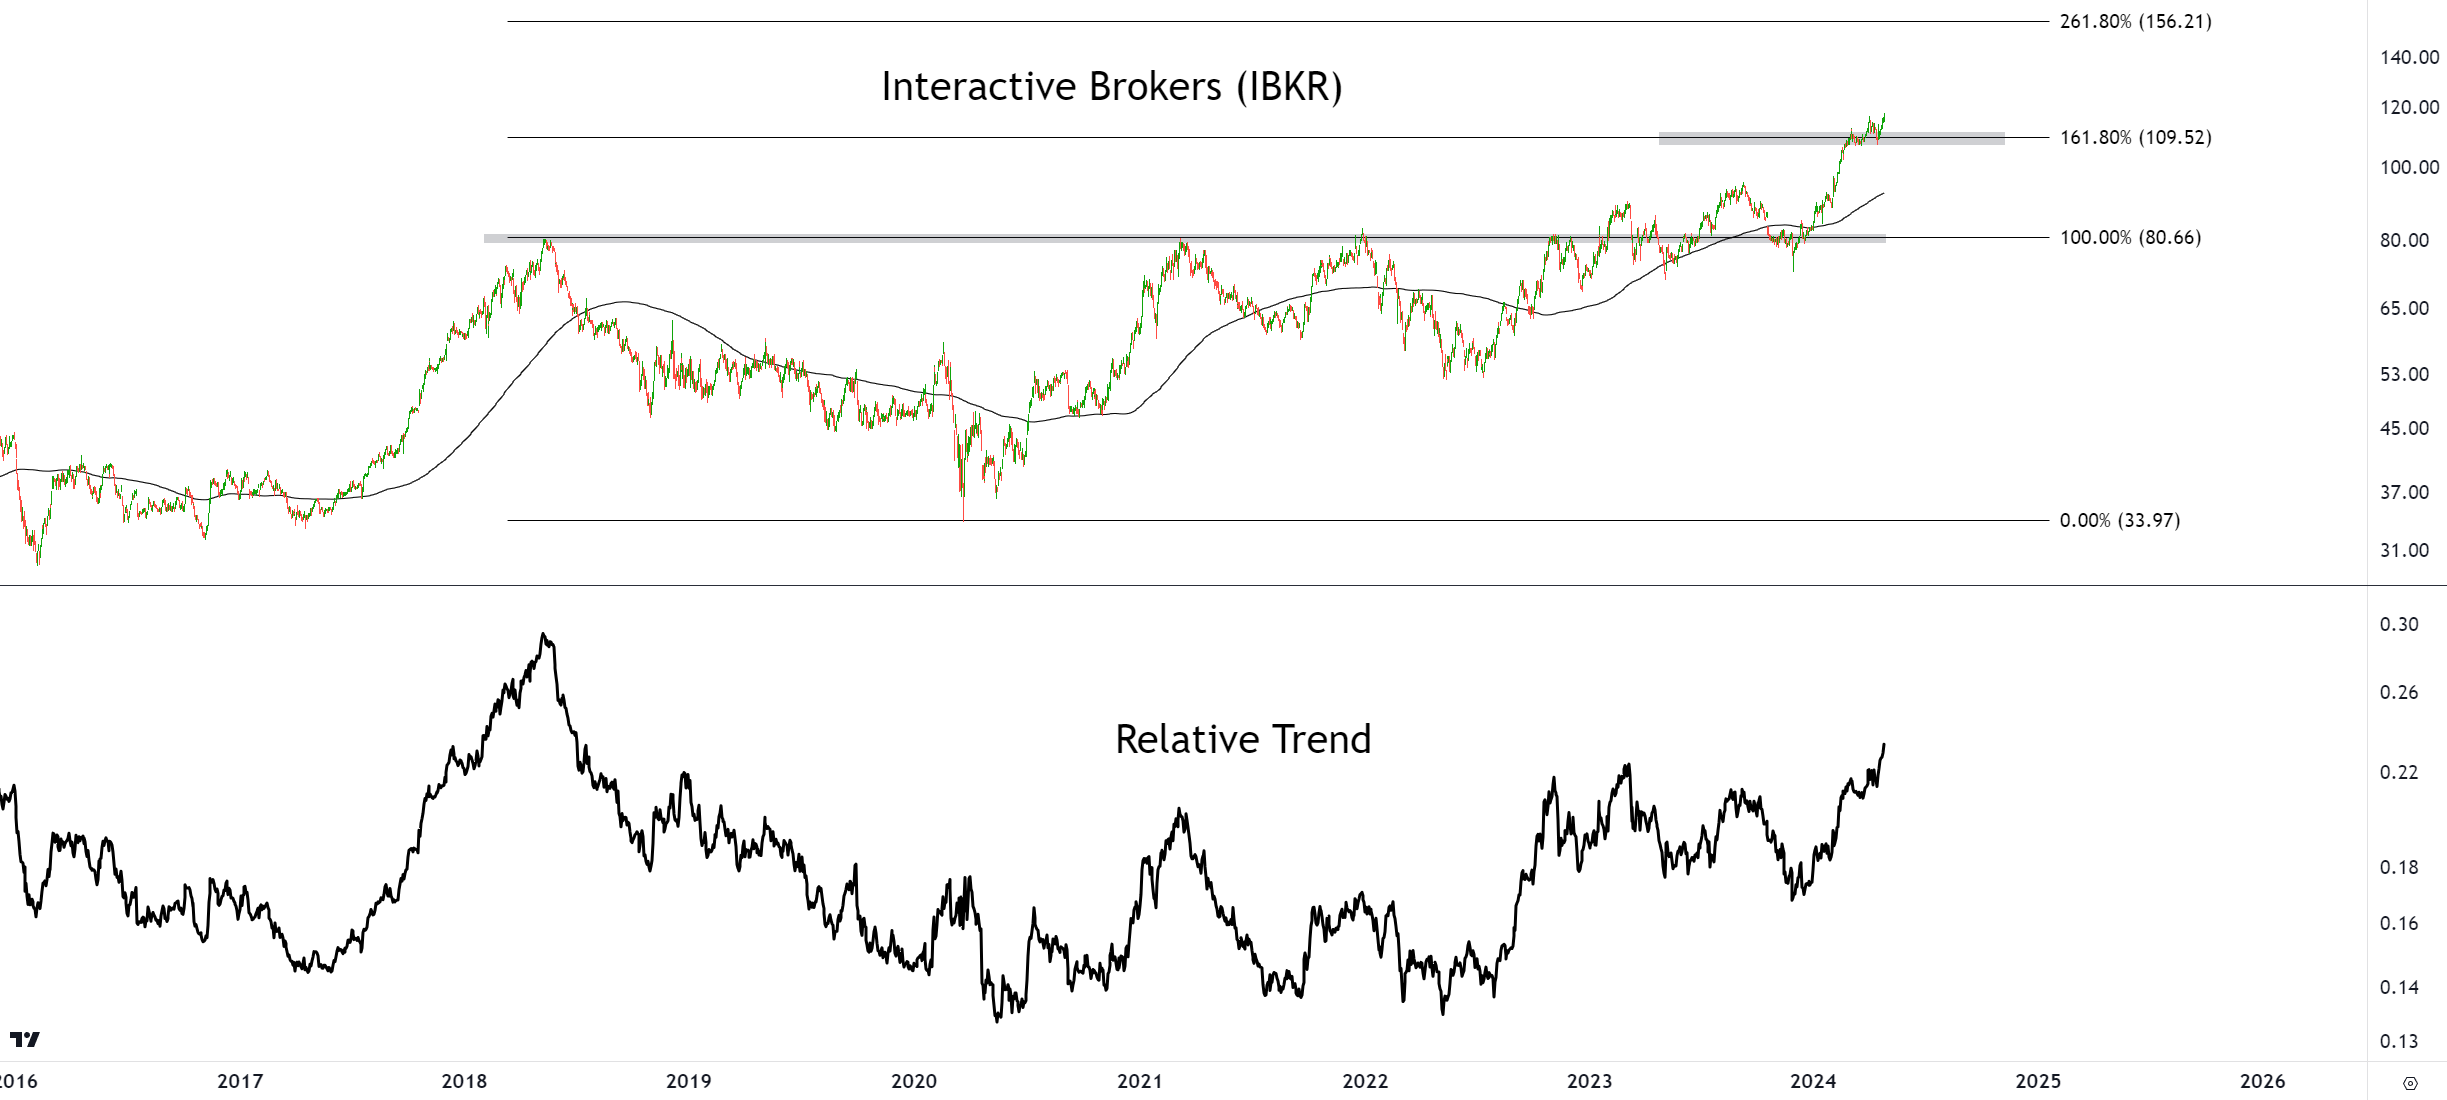
The technical analysis of IBKR suggests that if the stock is trading above 110, the bias is higher toward 156. The price chart shows a potential bullish trend, with the stock consistently trading above the 110 level. This indicates a strong support level and a potential for further upside movement toward the 156 level.
Investors should closely monitor the stock's performance and consider the underlying factors affecting Interactive Brokers' business before making any investment decisions.
For more technical analysis sign up for the FREE Chart Of The Day.
Recent Posts
Technical Analysis of Gap Inc.
Gap Inc. is a leading global retailer that offers clothing, accessories, and personal care products for men, women, and children. With a portfolio of well-known brands including Gap, Old Navy, Banana Republic, and Athleta, Gap Inc.
Technical Analysis of CCC Intelligent Solutions
CCC Intelligent Solutions Holdings, Inc. is a provider of innovative cloud, mobile, telematics, hyperscale technologies, and applications for the property and casualty (“P&C”) insurance economy.
Technical Analysis of Dick's Sporting Goods Inc.
Dick's Sporting Goods Inc. is a leading sporting goods retailer that offers a wide range of athletic apparel, footwear, equipment, and accessories.
Technical Analysis of Credo Technology Group Holdings
Credo Technology Group Holding Ltd. engages in the development of connectivity solutions and products for the data infrastructure market.
Technical Analysis of HP Inc.
HP Inc. is a leading technology company that specializes in providing a wide range of products and solutions for personal computing, printing, and imaging. With a strong presence in the global market, HP Inc.