Goldman Sachs (GS) is a leading global investment banking, securities, and investment management firm. With a wide range of financial services, including investment banking, asset management, and securities trading, Goldman Sachs serves a diverse client base, including corporations, governments, and individuals.
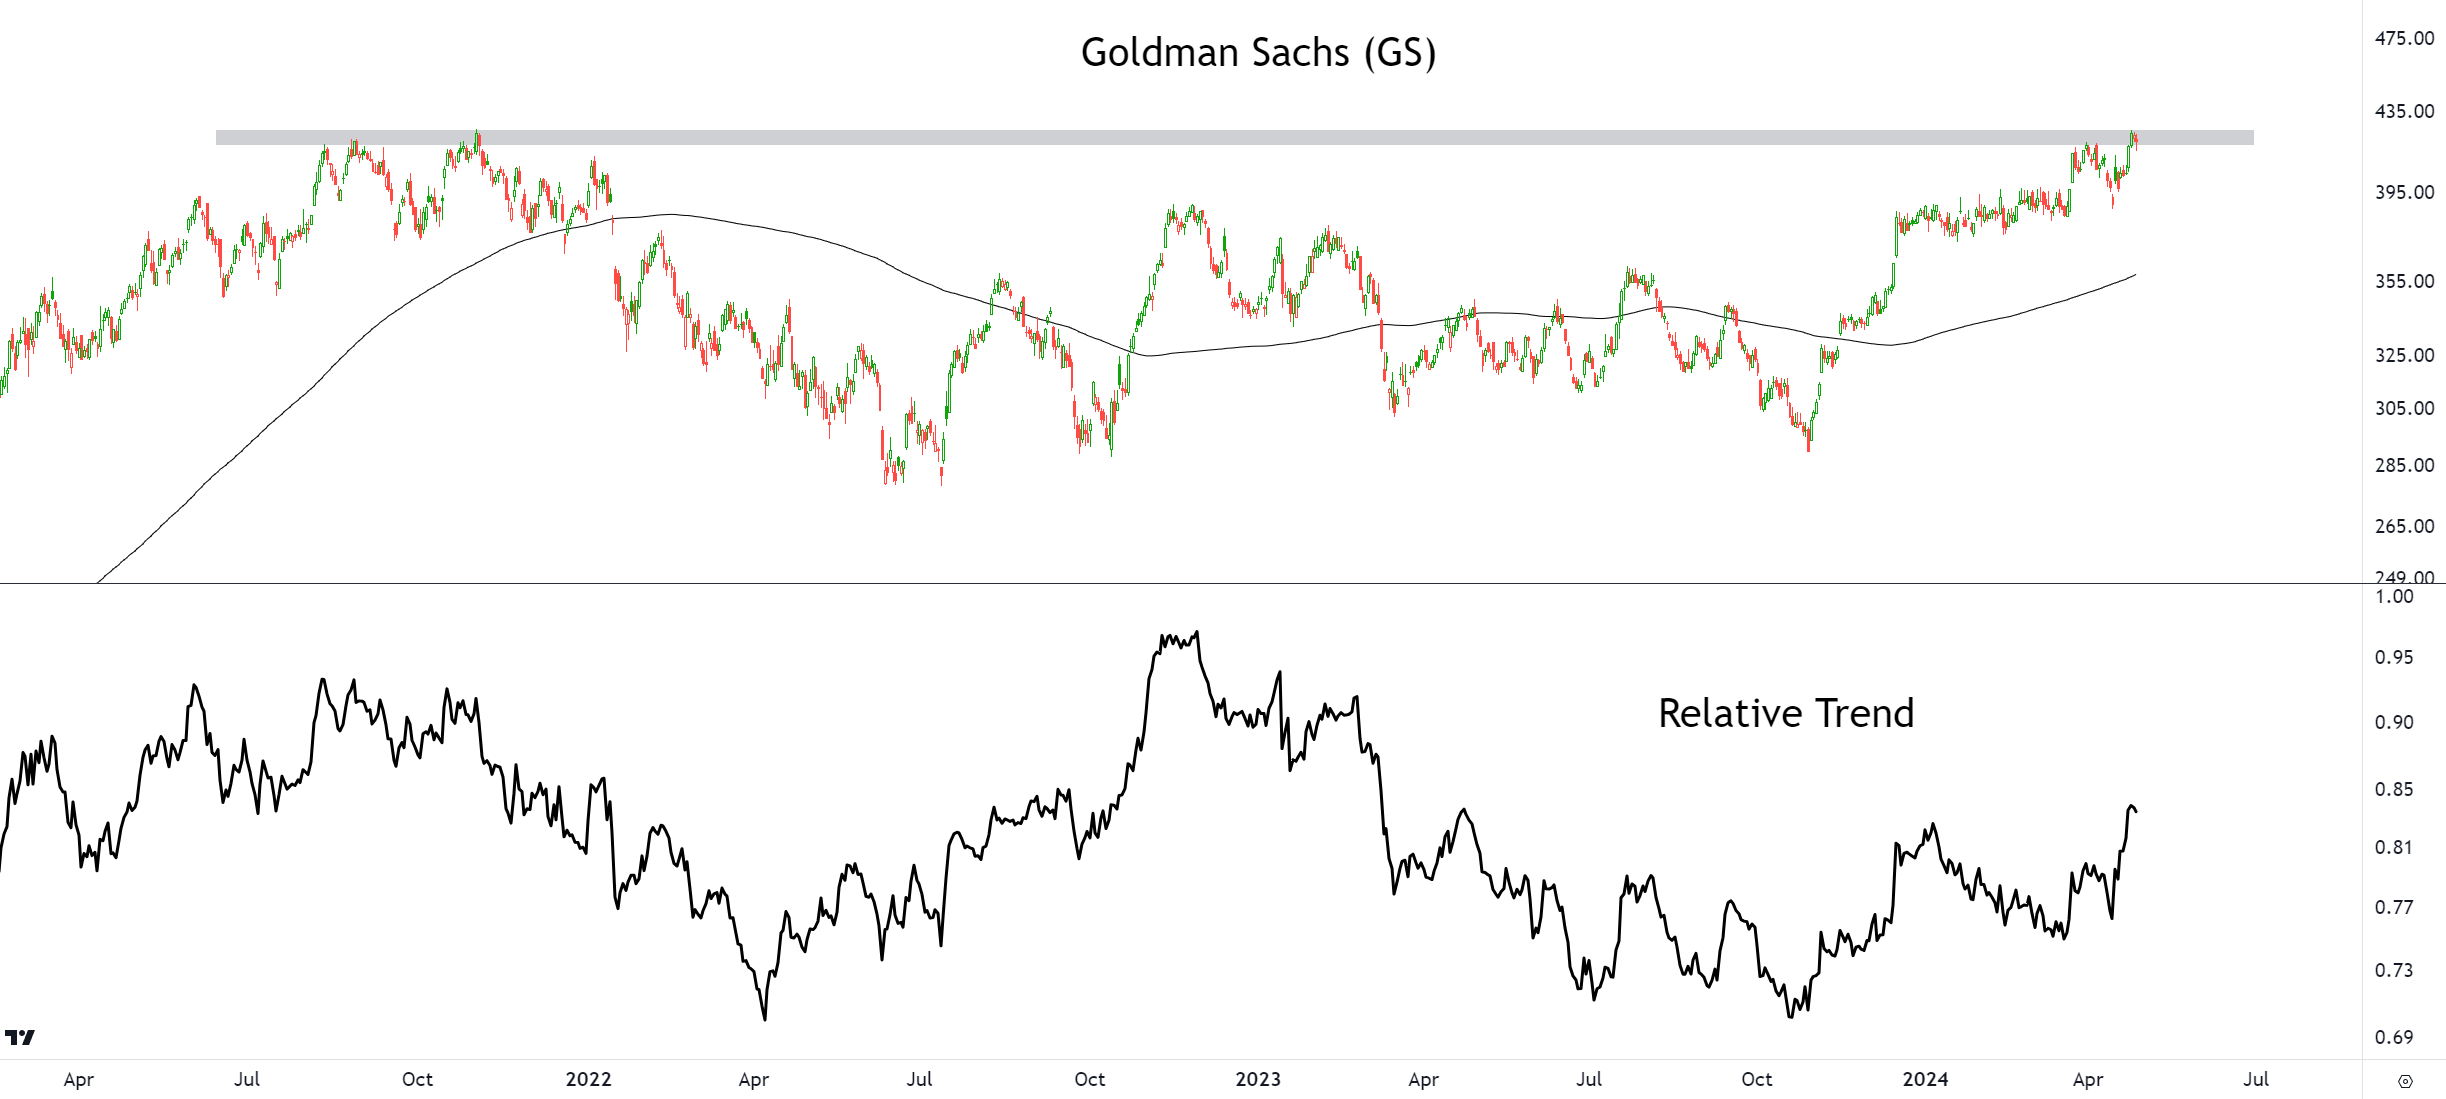
The technical analysis of GS suggests that the stock has built a base and the trend is higher. The price chart shows a period of consolidation and sideways movement, indicating a strong support level. Recently, the stock has started to move higher, breaking out from the base and establishing a new upward trend.
Investors should closely monitor the stock's performance and consider the underlying factors affecting Goldman Sachs' business before making any investment decisions.
For more technical analysis sign up for the FREE Chart Of The Day.
Recent Posts
Technical Analysis of Gap Inc.
Gap Inc. is a leading global retailer that offers clothing, accessories, and personal care products for men, women, and children. With a portfolio of well-known brands including Gap, Old Navy, Banana Republic, and Athleta, Gap Inc.
Technical Analysis of CCC Intelligent Solutions
CCC Intelligent Solutions Holdings, Inc. is a provider of innovative cloud, mobile, telematics, hyperscale technologies, and applications for the property and casualty (“P&C”) insurance economy.
Technical Analysis of Dick's Sporting Goods Inc.
Dick's Sporting Goods Inc. is a leading sporting goods retailer that offers a wide range of athletic apparel, footwear, equipment, and accessories.
Technical Analysis of Credo Technology Group Holdings
Credo Technology Group Holding Ltd. engages in the development of connectivity solutions and products for the data infrastructure market.
Technical Analysis of HP Inc.
HP Inc. is a leading technology company that specializes in providing a wide range of products and solutions for personal computing, printing, and imaging. With a strong presence in the global market, HP Inc.