When I think about the strongest stocks, I’m not just looking for outperformance across different timeframes. The strongest stocks should be back to our through their old bull market highs.
Let’s discuss the materials sector in this light.
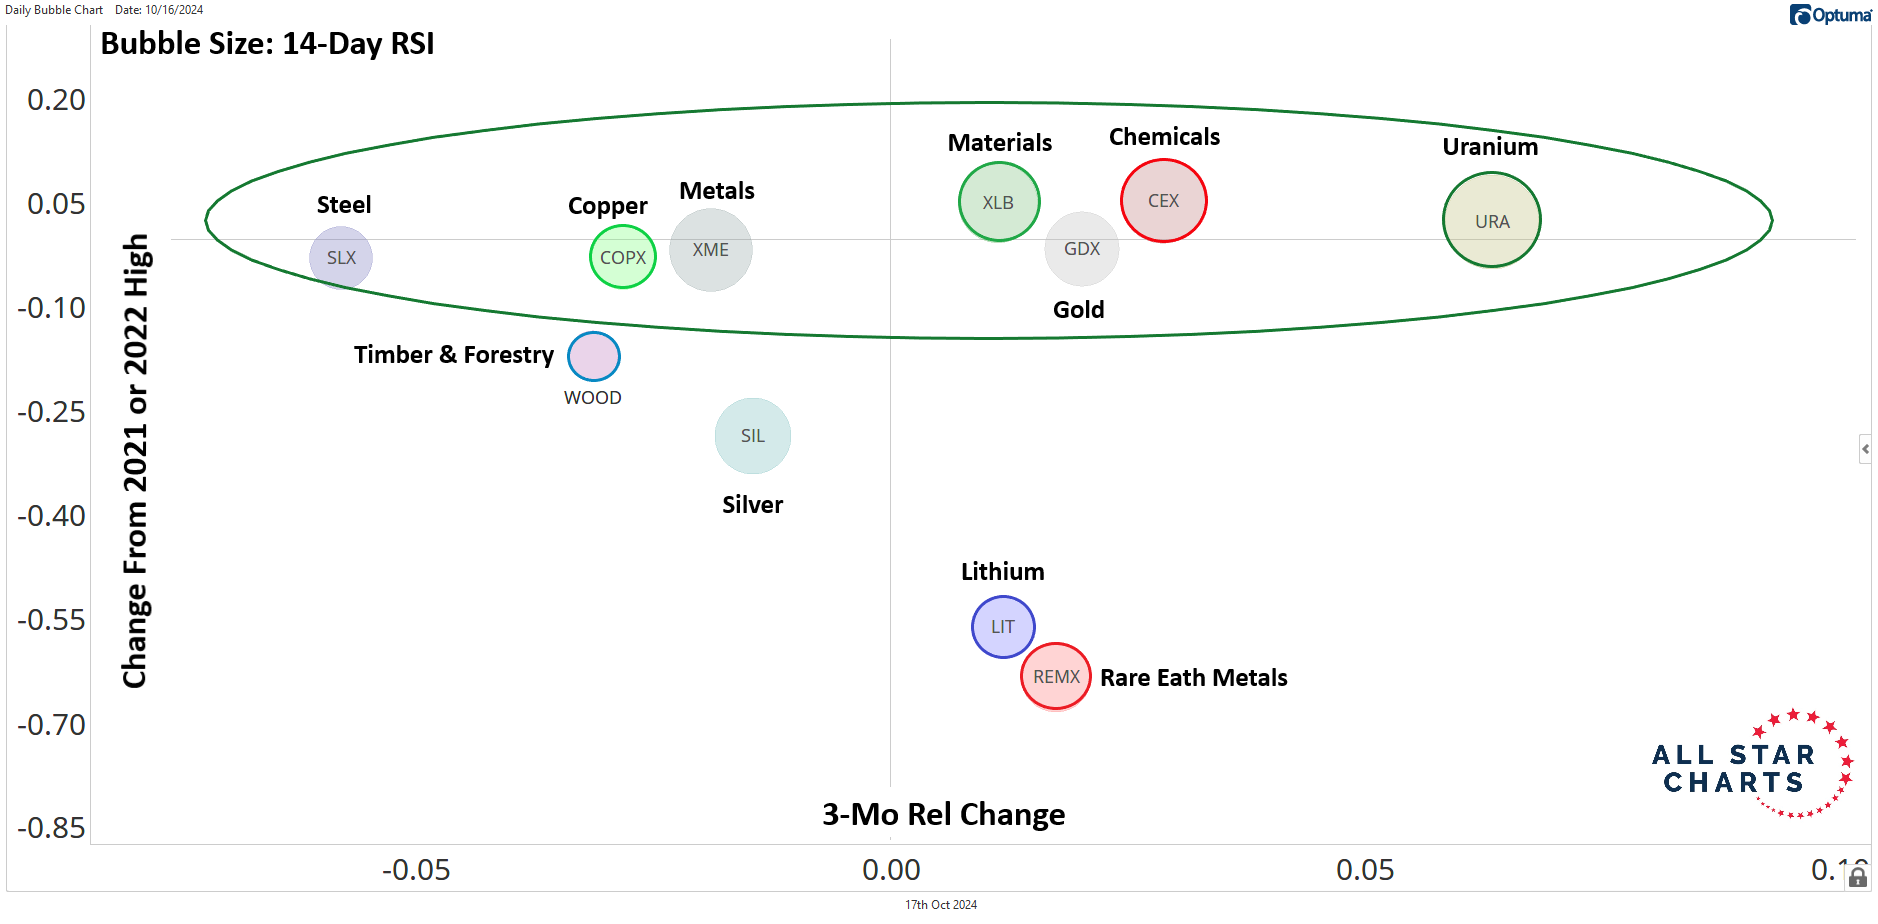
The bubble chart below shows the change from the 2021-2022 highs on the Y axis and the 3-month relative change on the X axis. I'm graphing all the materials industry groups to see how they stack up.
The areas that really catch my attention are those enclosed in the oval at the top of the chart, as they show the groups returning to their previous highs and potentially breaking out of multi-year bases.
What sets uranium apart, however, is its position on the far right of the chart. This speaks to the strong outperformance from these stocks over the trailing quarter.
The uranium theme becomes increasingly compelling when we look at the price chart…
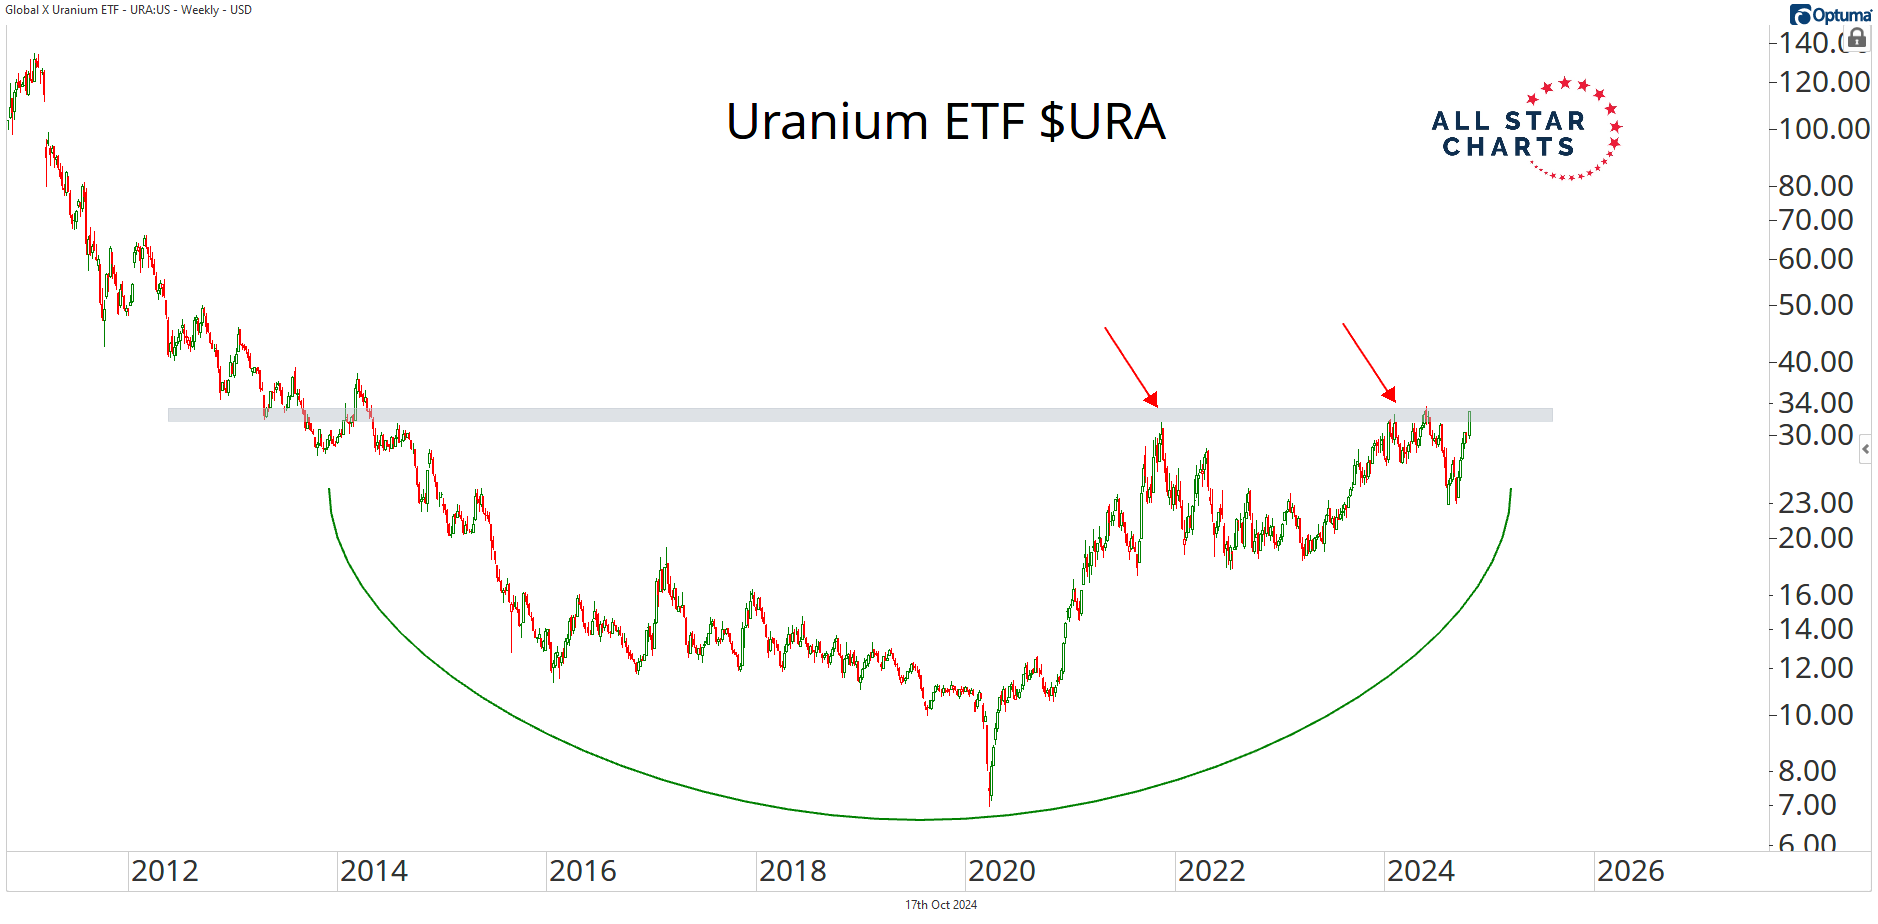
Check out this decade-long base for the Uranium ETF $URA:
Price is on the verge of resolving higher from this rounding bottom formation.
If and when we get a decisive breakout, we want to be long the top uranium names.
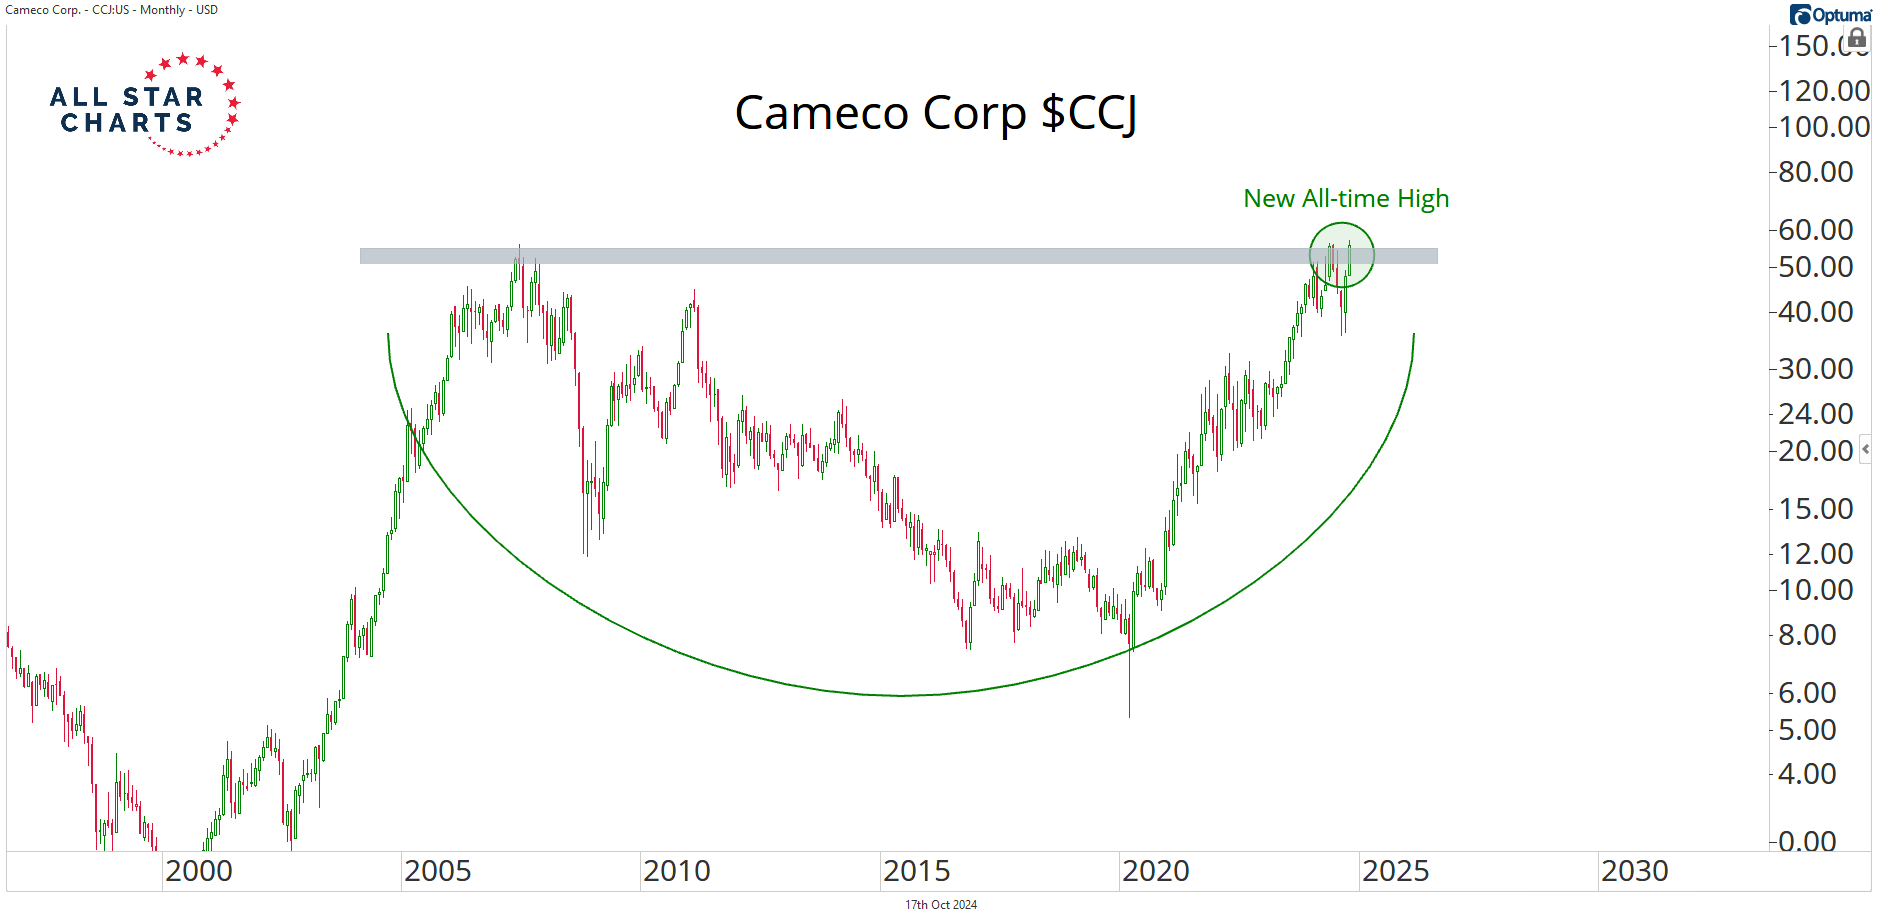
The ETFs largest component is Cameco $CCJ, representing over 24% of the fund.
Cameco is the bellwether of the nuclear power industry.
Here’s the chart:
CCJ is breaking out of a massive base dating back to 2007.
The stock has literally made no progress for 17 years.
You know how the saying goes…“The bigger the base, the higher in space.”
If this one goes, the rest will follow.
Depending on your risk tolerance and strategy, there are multiple ways to express a bullish thesis on uranium and nuclear power.