A simple moving average is a lagging indicator that technicians use to help with the trend recognition process. It smooths out the erratic day-to-day action and shows us the mean price over a stated period.
A rising average is indicative of uptrends, while a falling average is indicative of downtrends.
Moving averages can also be used to analyze a market's internals.
One of my favorite ways to use them is to measure the number of stocks holding above or breaking below their long-term mean.
If a stock is above its 200-day, it’s probably not in a downtrend.
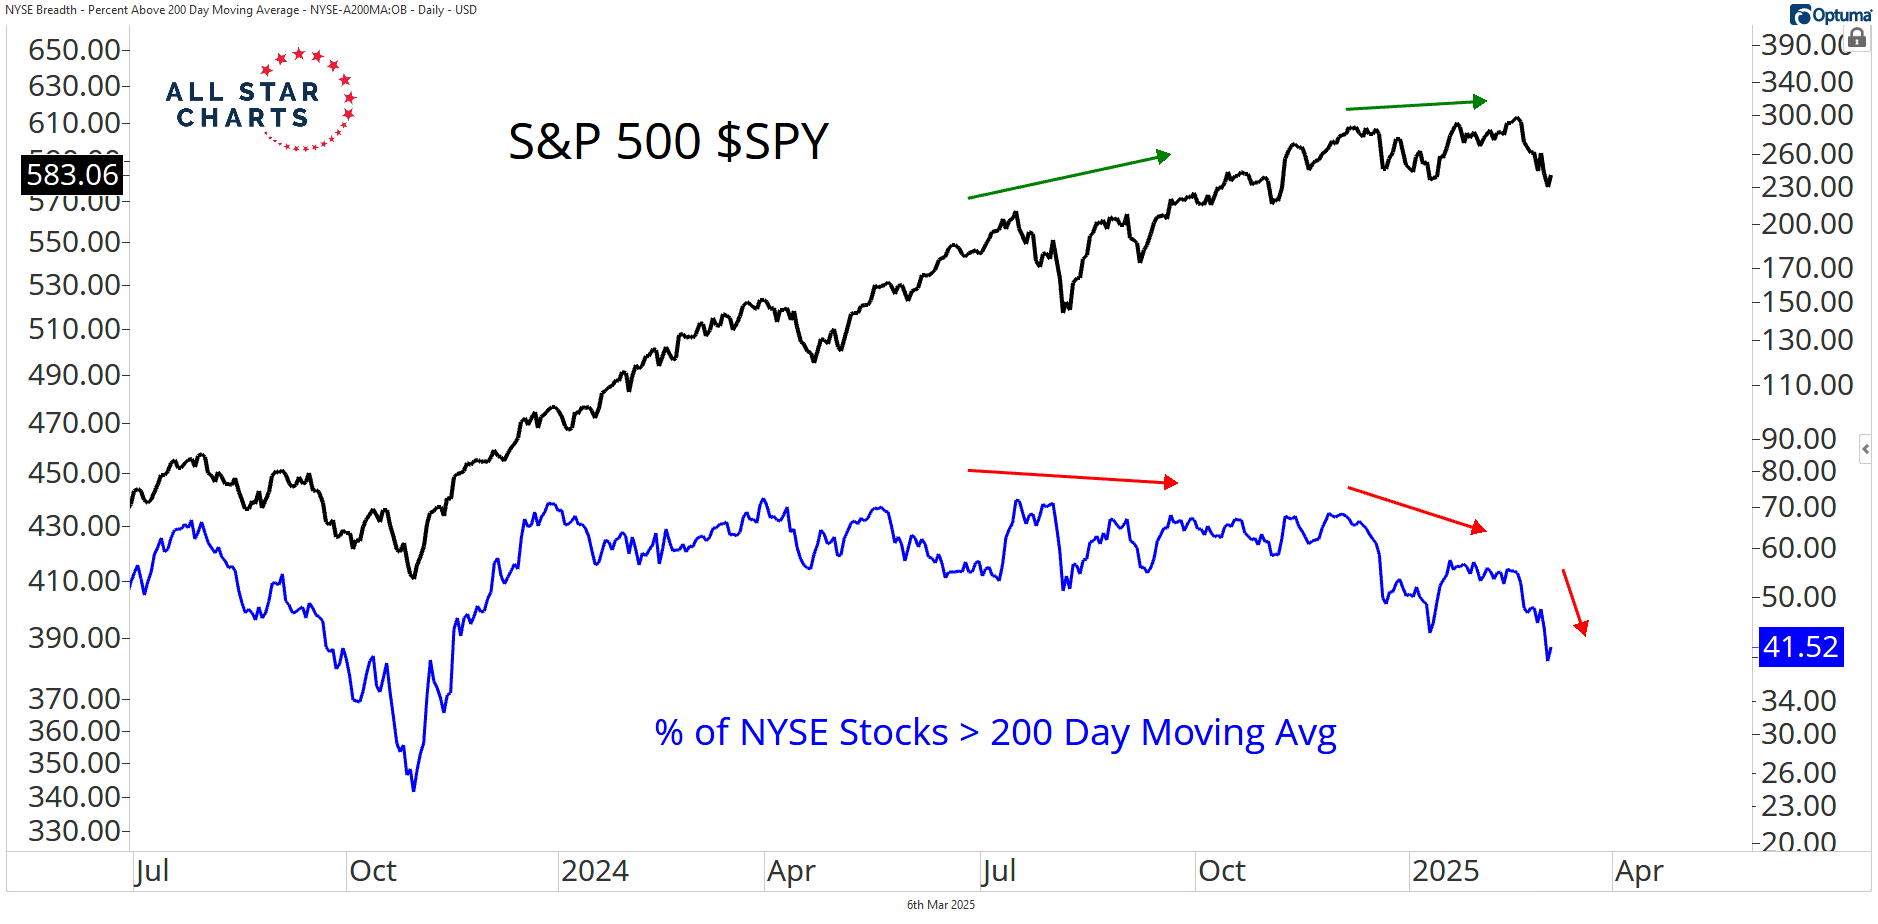
The chart below shows the S&P 500 overlaid with the percentage of NYSE stocks above their 200-day moving average.
This gives us a broad view of what is going on beneath the hood.
During strong and healthy bull markets, I expect the indicator to remain elevated.
Right now, that percentage has dropped to its lowest level since November 2023.
This means that more and more stocks are struggling to stay in uptrends, and as fewer of them manage to hold the line, it raises doubts about the strength of this market.
Bulls need to take action and fix the damage, or we could be facing more pain ahead...