The S&P 500 Technology Sector has been in an uptrend for the past 496 trading days.
Here’s the chart:
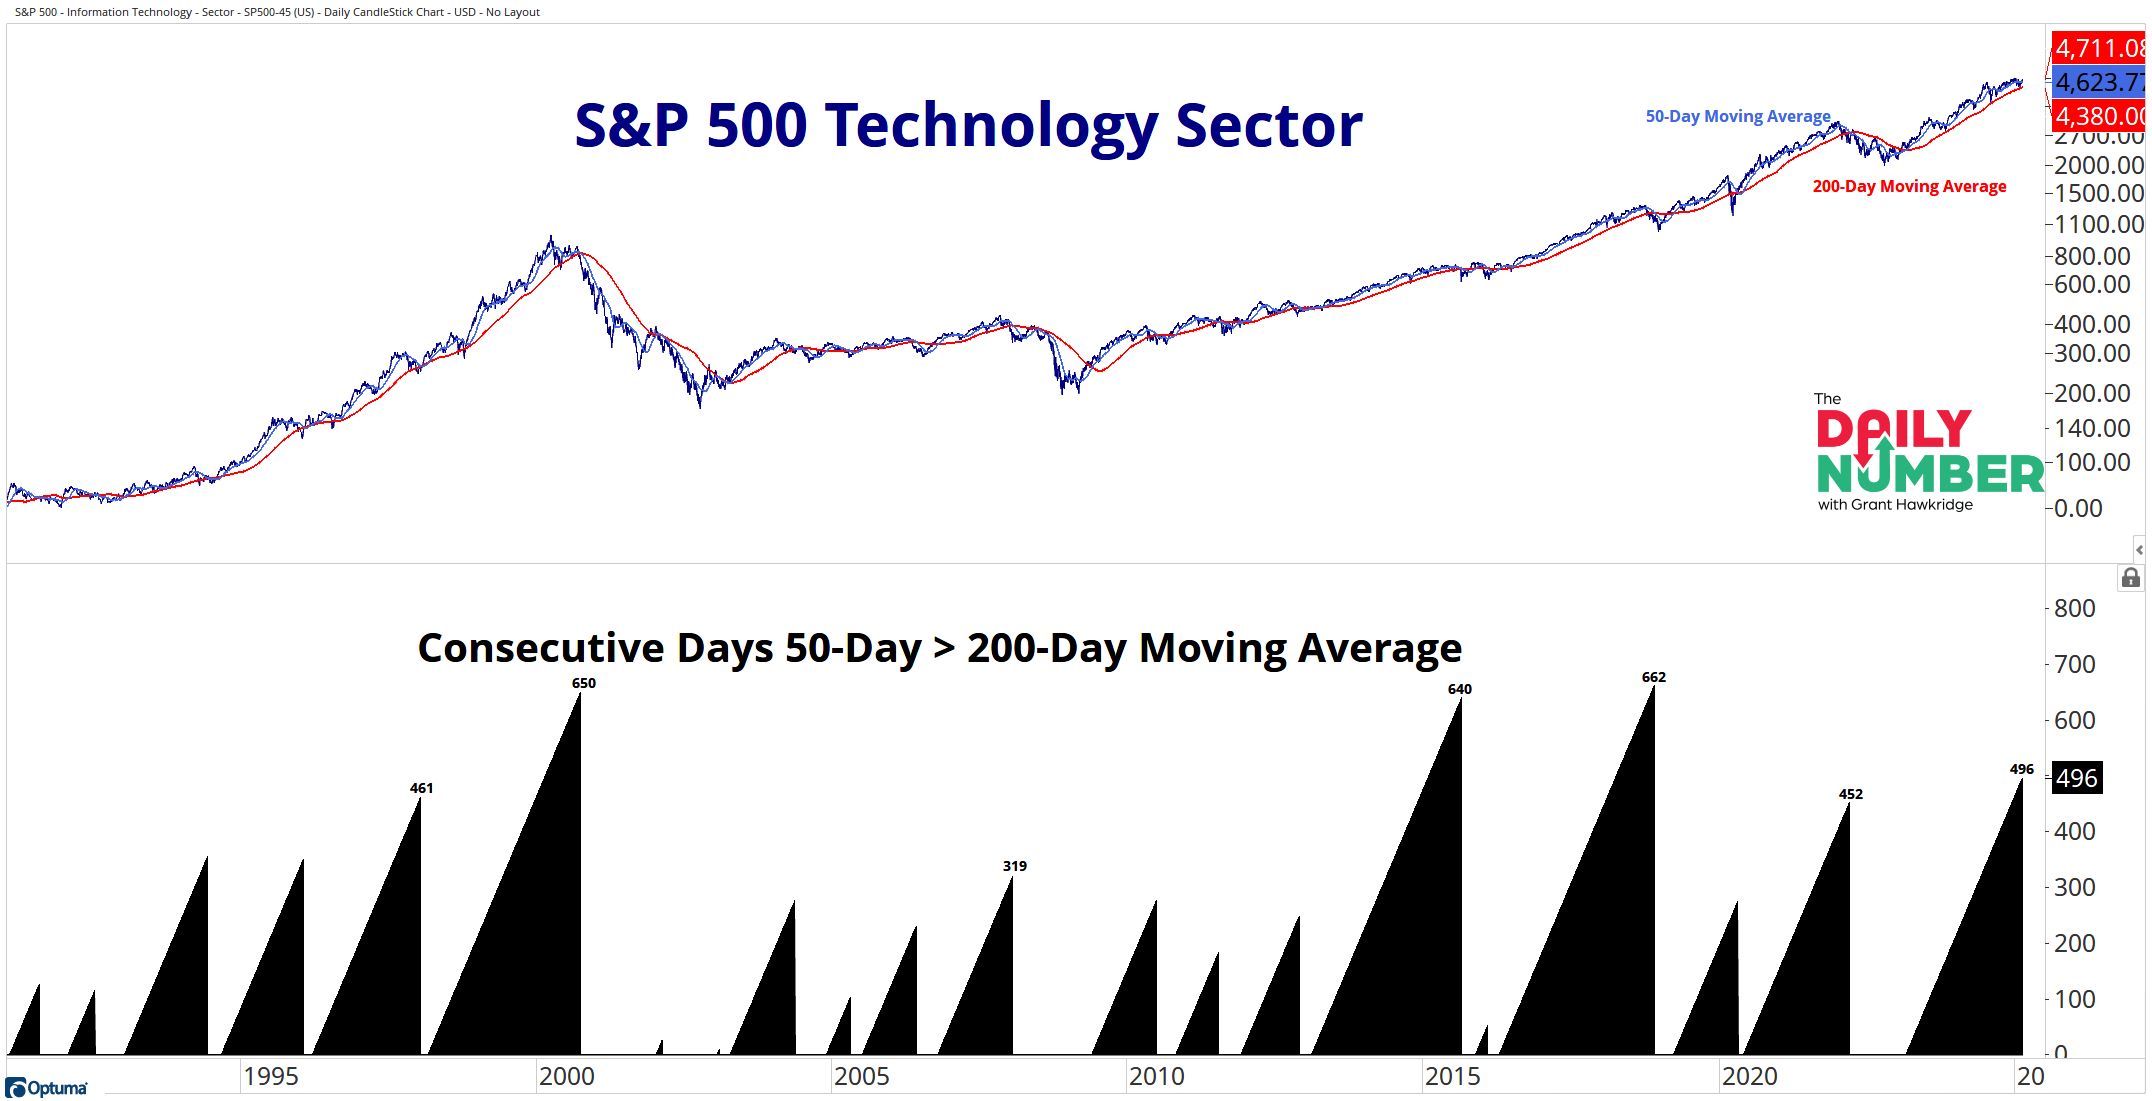
Let's break down what the chart shows:
The dark blue line in the top panel represents the S&P 500 Technology Sector price. The light blue line represents the 50-day moving average, while the red line shows the 200-day moving average of the S&P 500 Technology Sector.
The black bars in the bottom panel indicate days when the 50-day average is greater than the 200-day average.
The Takeaway: There are many ways to define an uptrend. One very simple yet effective method is to check whether its 50-day moving average is above its 200-day moving average.
The S&P 500 Technology Sector's trend has been higher for the past 496 trading days. This current uptrend is actually the fourth longest we have seen in the Sector over the past three decades.
Despite some underperformance from the sector more recently, the S&P 500 Technology Sector remains within a well-defined uptrend. It’s hard to be pessimistic about the market, especially given the strength of this current uptrend in the sector.
In bull markets, it's essential to have your best players actively participating, and there's no sector better than Large-Cap Technology.
Grant Hawkridge | Chief Aussie Operator, All Star Charts
ICYMI: Steve Strazza has been absolutely crushing it with his Breakout Multiplier trades. His next alert is dropping soon, and he is offering a 40% discount to get you in.
If you find my content valuable, I would greatly appreciate it if you could share it with your friends, family, and colleagues. Your help in spreading the word is invaluable in supporting our work. Thank you to all of you who share!