We are now two months into 2025, and we are closely following the same path of the average post election cycle. What's next?
Here’s the chart:
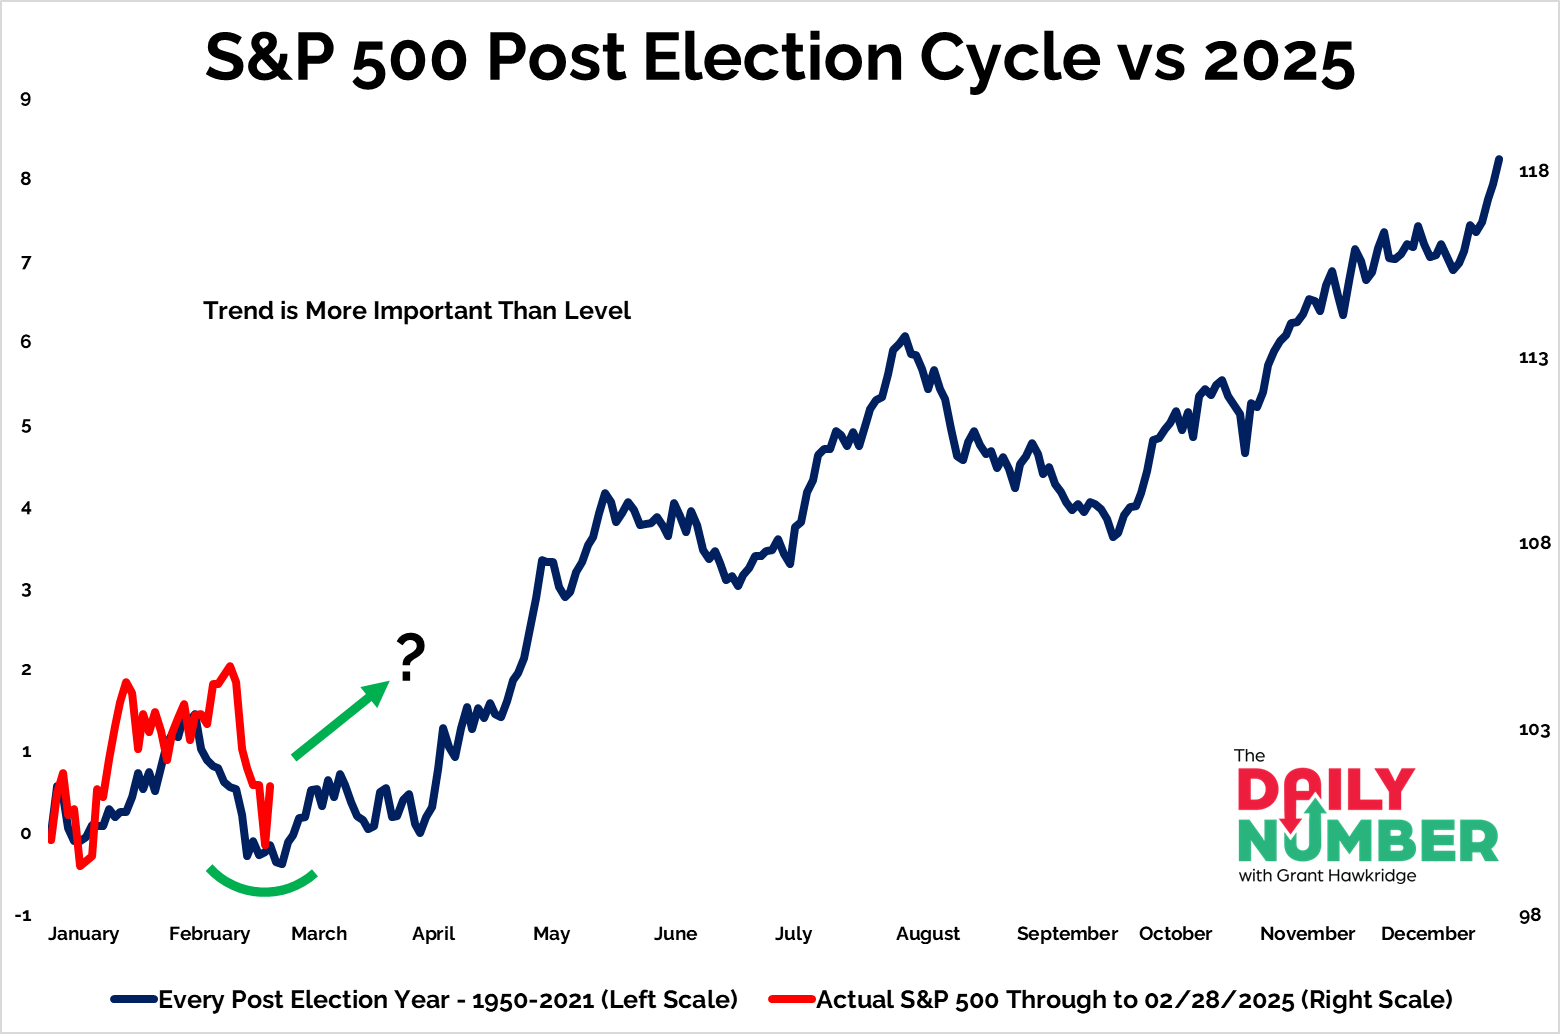
Let's break down what the chart shows:
The blue line represents the average return in post election years since 1950 for the S&P 500.
The red line represents the S&P 500 in 2025.
The Takeaway: In the first two months of the year, the S&P 500 has followed its typical pattern for the post-election cycle.
Up in January.
Down in February.
If stocks continue to follow this seasonal trend, we may have seen the bottom for the market. I wouldn’t be surprised to see stocks rip higher into the end of the year, given that the average post election cycle is now transitioning into a tailwind for stocks.
However, if we start to see weakness during what is typically a strong seasonal period for stocks, that would pique my interest much more. For now, stocks are simply following their usual seasonal tendencies.
Grant Hawkridge | Chief Aussie Operator, All Star Charts
ICYMI: What happens next in the AI trade? NVIDIA may have just told us. JC, Spencer, and Kenny broke down real-time reactions, key levels to watch, and what this means for big tech moving forward. Click here to watch the replay — and for a limited time, get into Kenny’s Live Trading Room at a discount so you’re never late to the trade.
If you find my content valuable, I would greatly appreciate it if you could share it with your friends, family, and colleagues. Your help in spreading the word is invaluable in supporting our work. Thank you to all of you who share!