Whether you're looking at short, intermediate, or long-term trends, 100% ofthe major indices are currently trading below their key moving averages.
Here’s the table:
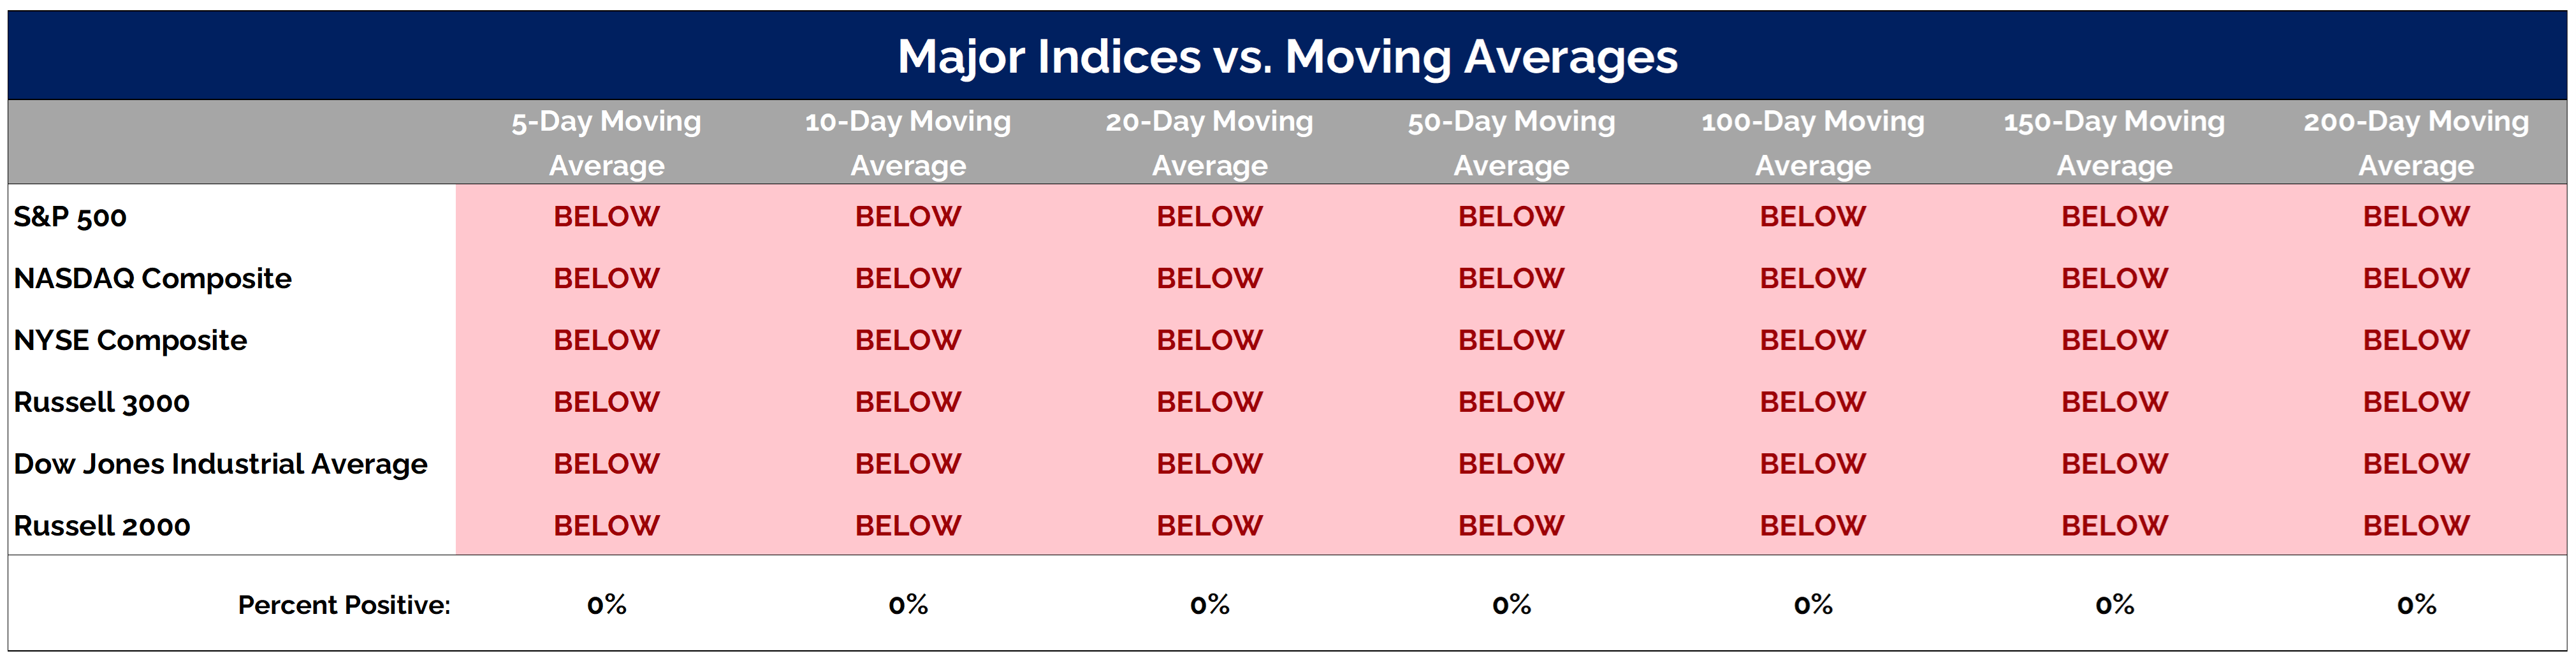
Let's break down what the table shows:
The first column of the table lists several major indexes. Each subsequent column represents a different moving average, ranging from the 5-day average to the 200-day average. A green box indicates that the index price is above the particular moving average, and a red box shows that the index price is below that moving average.
The Takeaway: The way I learned it was not to fight the trend… Also, nothing good happens when price is below moving averages.
And right now, all I can see is red... Every major index is below its 5-day moving average all the way to its 200-day moving average.
When prices fall below their moving averages, they are not in uptrends. They may not necessarily be in downtrends, but they certainly are not trending higher.
If stocks continue to decline, uptrends cannot persist. The math just doesn’t work.
In this type of market environment, it's a good idea to consider the following question: Should we focus more on finding stocks to buy, or should we devote more time to identifying stocks to sell?
Grant Hawkridge | Chief Aussie Operator, All Star Charts
ICYMI: It’s been a brutal month for retail, but Jeff Macke’s been here before — and he knows exactly what to do next. Watch this video of Jeff and JC to hear his updated retail playbook and see how he’s positioning in this downturn.
If you find my content valuable, I would greatly appreciate it if you could share it with your friends, family, and colleagues. Your help in spreading the word is invaluable in supporting our work. Thank you to all of you who share!