Three of my key Risk-On/Risk-Off ratios are reaching new lows.
Here’s the chart:
Let's break down what the chart shows:
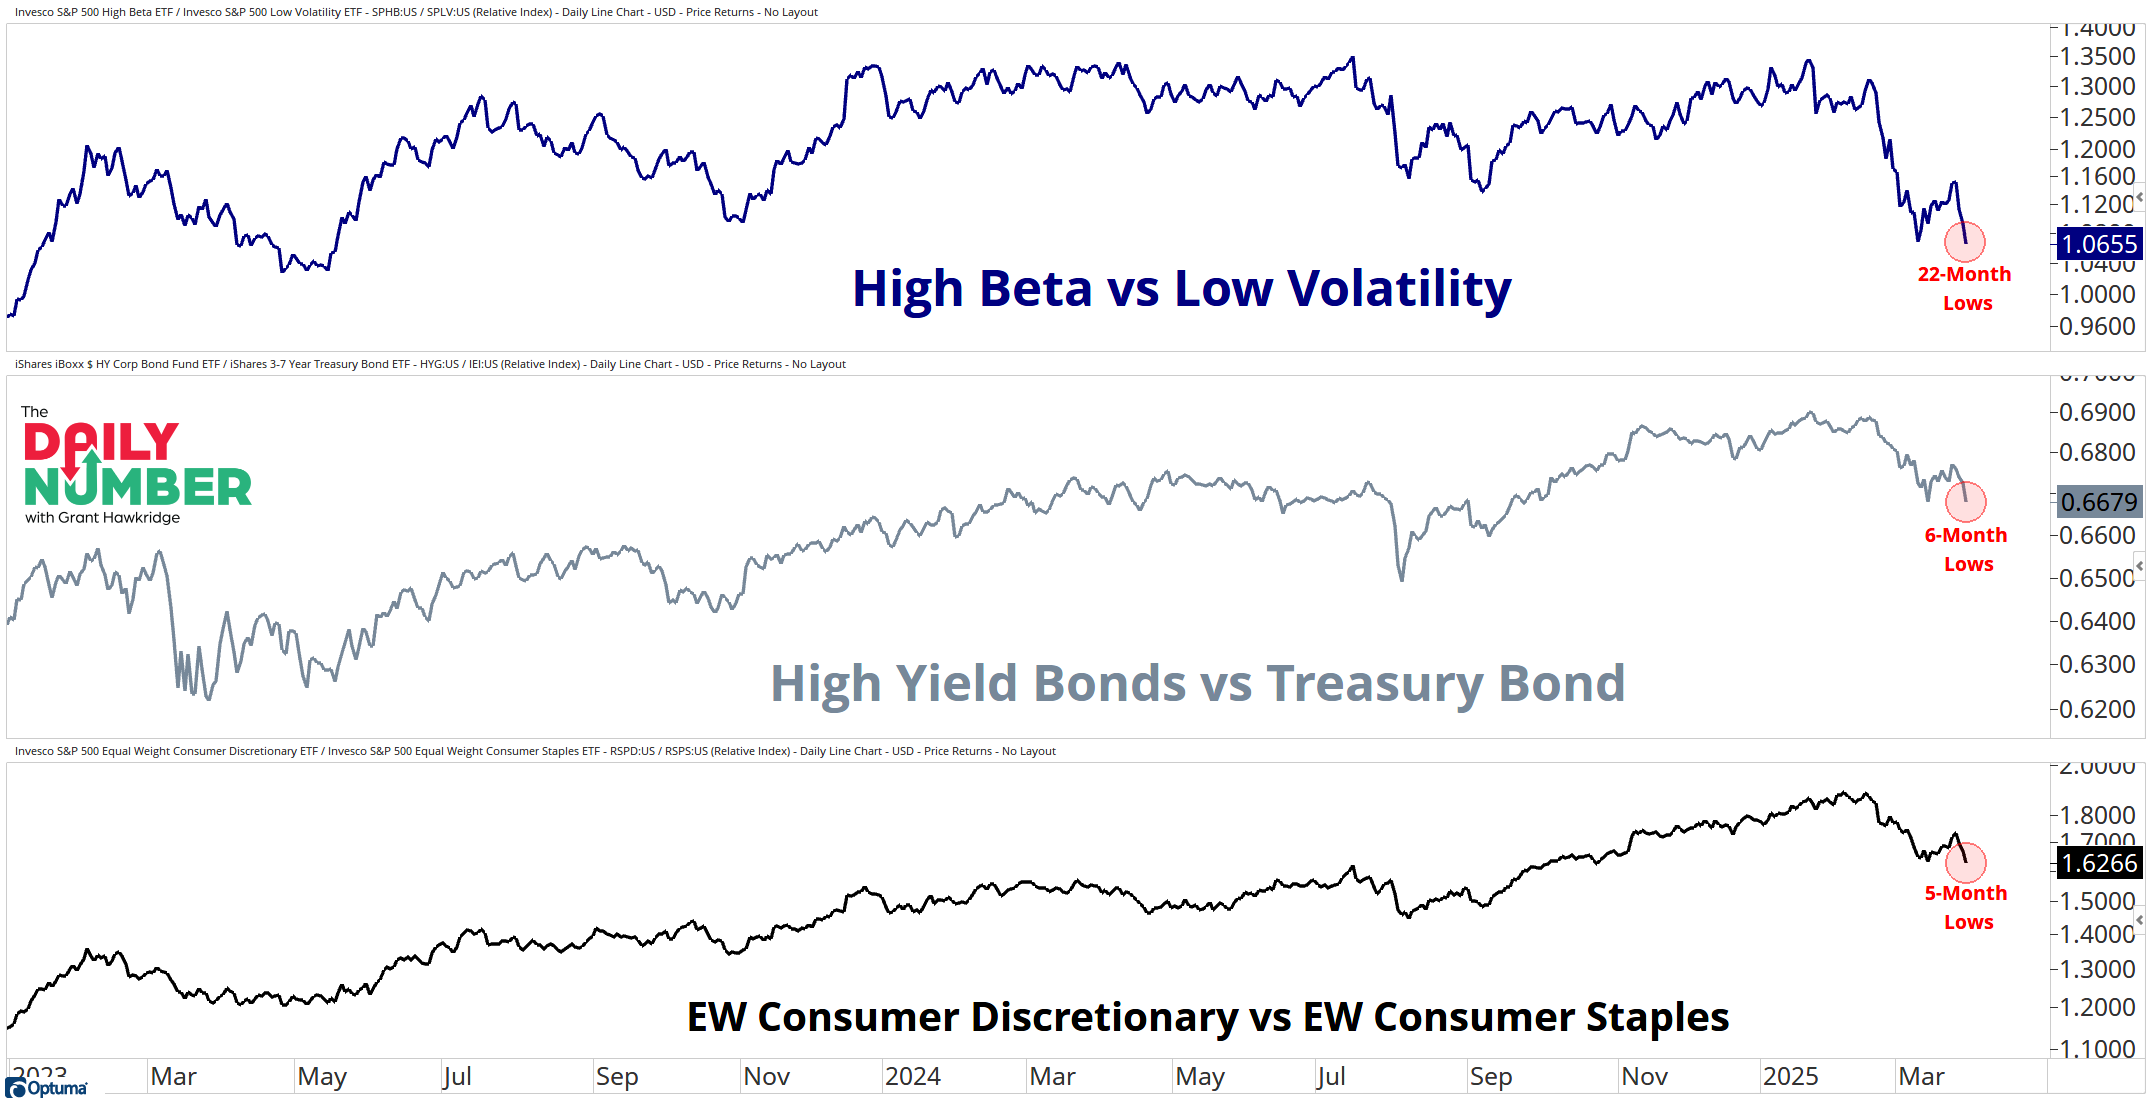
The blue line in the top panel illustrates the relative ratio of High Beta vs. Low Volatility. In the middle panel, the gray line represents the relative ratio of High Yield Bonds vs. Treasury Bonds. Lastly, the black line in the bottom panel depicts the relative ratio of Equal Weight Consumer Discretionary vs. Equal Weight Consumer Staples.
If these ratios rise, the numerator (risk-on) is outperforming the denominator (risk-off); if they are falling, the denominator(risk-off) is outperforming the numerator (risk-on).
The Takeaway: These three ratios are my go-to favorite Risk-On/Risk-Off barometers: High Beta vs. Low Volatility, High Yield Bonds vs. Treasury Bonds, and Equal Weight Consumer Discretionary vs. Equal Weight Consumer Staples.
In healthy bull markets, these ratios move up and to the right on the chart.
Right now, they are not…
They are moving lower…
High Beta vs. Low Volatility is at 22-month lows.
High-Yield Bonds vs. Treasury Bonds are at 6-month lows.
Equal Weight Consumer Discretionary vs. Equal Weight Consumer Staples is at a 5-month low.
New lows are characteristics of bear markets, not bull markets.
If we're going to witness a significant rebound in stocks, I believe we will first see it reflected in these ratios.
The way these ratios react from this point onward will provide valuable insights into how investors are positioning themselves for the remainder of the year.
Until we see a bend in these downtrends, this is just another data point in the bear's bucket.
Grant Hawkridge | Chief Aussie Operator, All Star Charts
ICYMI: JC and Jason hosted a special event last Thursday, offering insights into what's next in commodities. Catch the replay here.
If you find my content valuable, I would greatly appreciate it if you could share it with your friends, family, and colleagues. Your help in spreading the word is invaluable in supporting our work. Thank you to all of you who share!