Every now and then I come across a chart that I feel the need to send over to our friends at the CMT association.
The curriculum covers all sorts of pattern recognition and analysis. While things don’t always work out the way the textbook teaches… sometimes, they do. And it’s just so lovely to see.
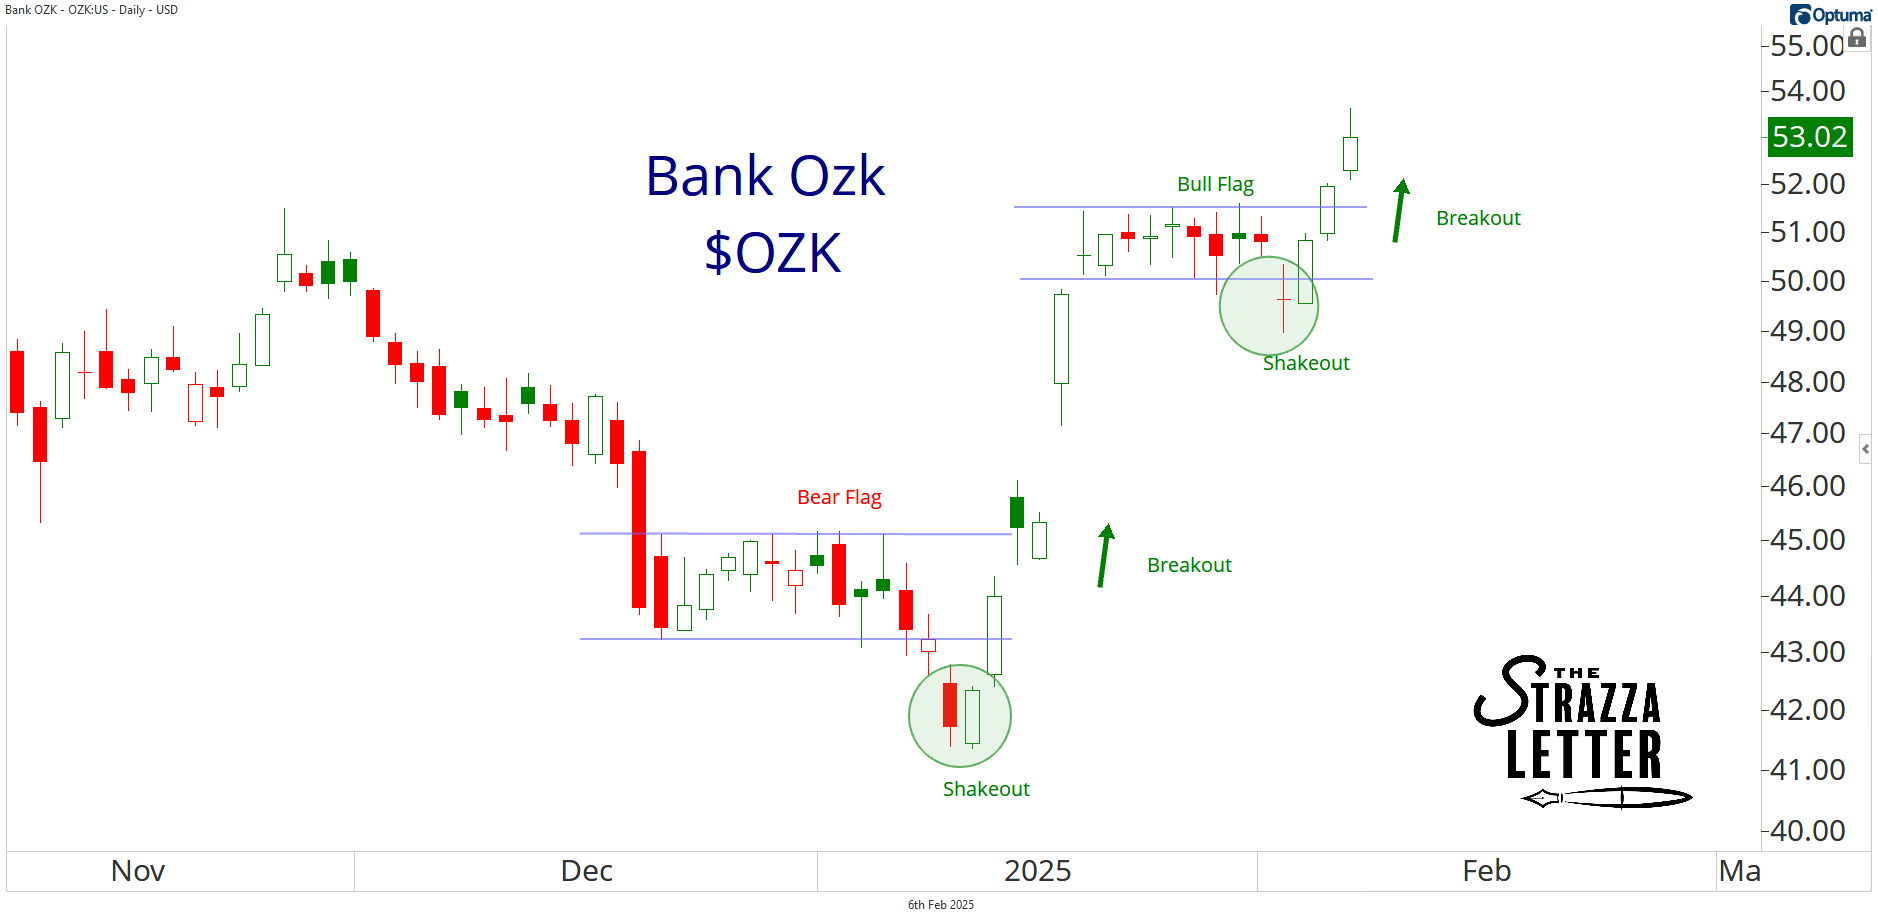
It’s happening now with the recent action in Bank OZK. Both of these flag pattern breakouts are picture perfect.
Let’s use this chart as an example to discuss the classic continuation pattern.
Price was coiling in a bear flag coming into the year.
The only difference between the first flag and the second flag is the trend that preceded them. When the trend that leads into the coil is down, it is a bear flag. When it is up, like it is now, it is a bull flag.
Another difference between the two formations is the way that they resolved. The bear flag resolution is actually considered a failed pattern as it resolved in the opposite direction of the downtrend that preceded it.
Failed patterns are some of the best patterns though. As you can see, the reaction rally out of this tight range was fierce.
Also notice how the rally followed a false move. The false moves are labeled as shakeouts on the chart. They are the same thing in my eyes. Let me explain.
According to Edwards and Magee, a false move is when price appears to resolve from a pattern, then returns back inside the pattern, and then ultimately proceeds out of the pattern in the opposite direction.
That last part is the most important.
In other words, a valid false move starts with a shakeout but ends with a breakout.
One more thing that characterizes this supply and demand dynamic is the fast move or momentum that often accompanies the breakout phase.
You saw it a few weeks ago after the false move as OZK ripped higher by 10% on the heels of earnings.
And you are seeing it again now…
Just look at the follow-through from OZK since its false move to the downside on Monday. It is up 7% in the last three days.
As the great Brian Shannon taught us, “from failed moves come fast moves.”
This is exactly what she was referring to.
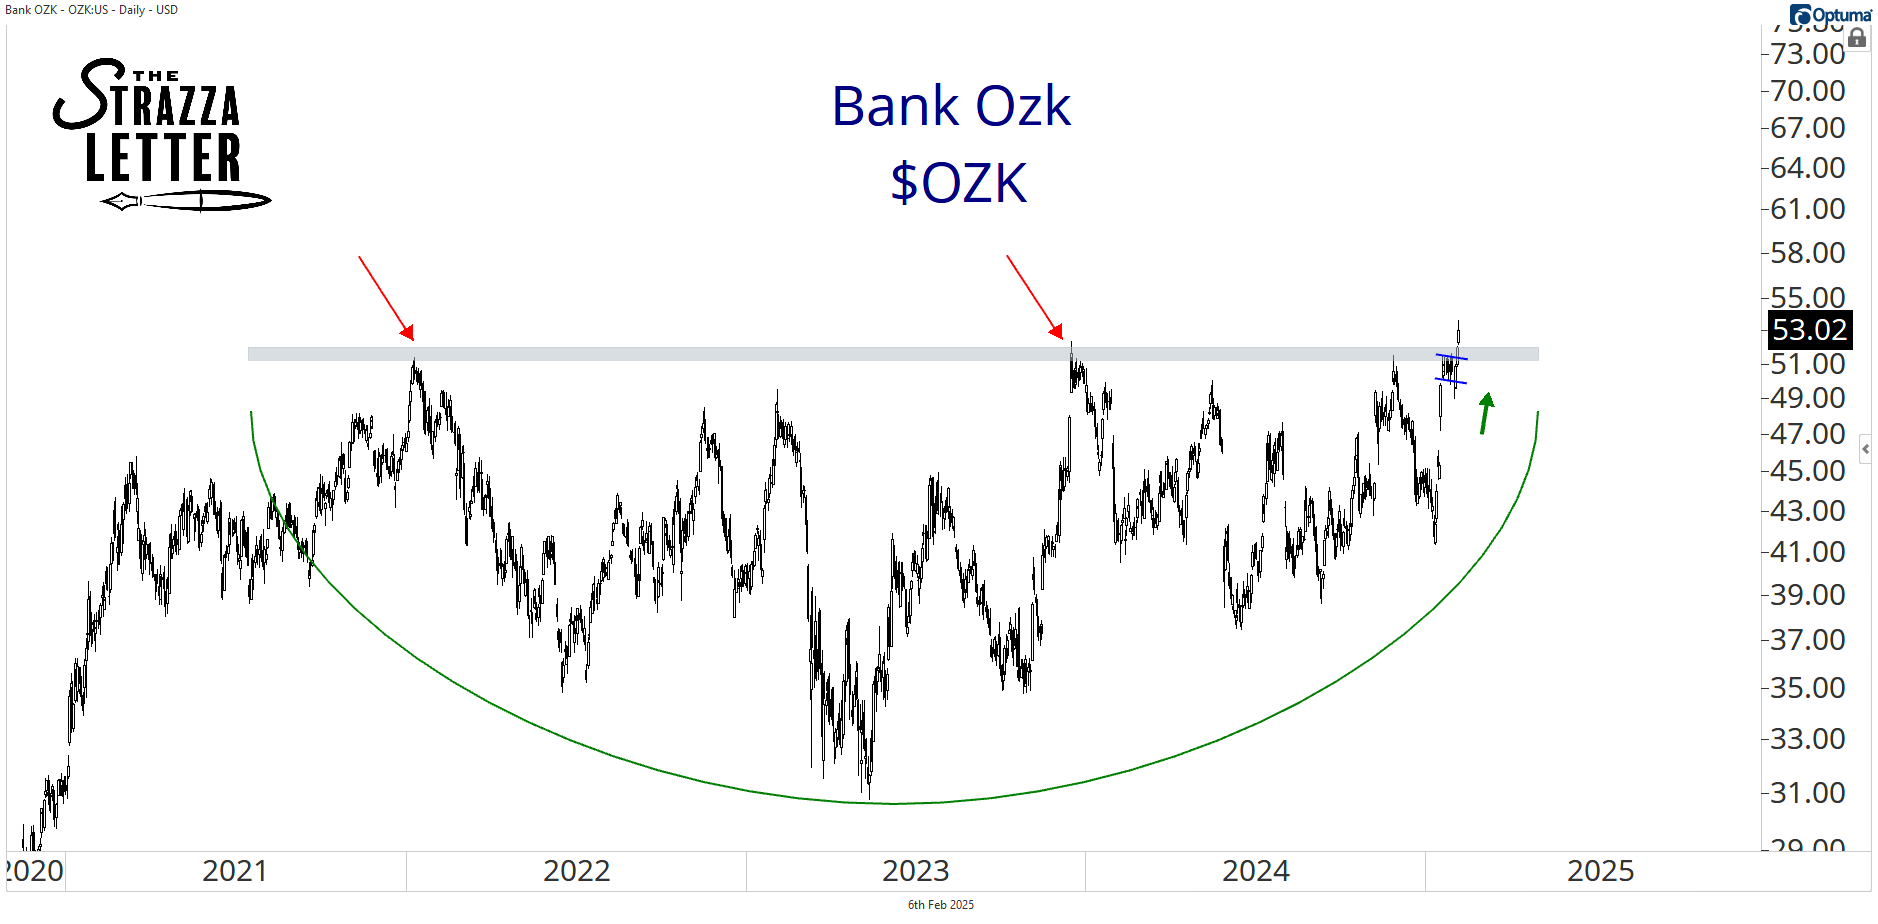
And when you zoom out on this setup it is even sweeter. This bull flag is resolving to the upside right at the breakout level of a three year base.
A measured target based on the 10 point or 25% flagpole length would put OZK just north of $60. And that would mean new all-time highs for the bank, in which case I’m thinking we probably go a lot higher.
I just love how the fractals are all lined up for the bulls on this one. A massive base. A multi-year base. A bull flag breakout. The shakeout that preceded it.
It’s all so textbook. This is how they teach it. They might even use this chart as an example in the future.
Anyways, I’m long. I got in after the shake on Tuesday and finished the position on today’s confirmation candle. I think it’s hard to have enough exposure to the banks right now. And it’s impossible to have enough exposure to a pattern like this regardless of the industry.
We would have put a breakout multiplier trade on this earlier in the week but there wasn’t enough options liquidity for us. We’ll buy this pattern every time we see it when we can. Sign up to get the next shakeout and breakout.