Stocks are under pressure in the US. Today marks the worst performance of the year for the S&P 500.
But, here’s the thing. It shouldn’t come as a surprise. US stocks haven’t been the leaders for a while.
The US major averages have been stuck sideways for about three months while equities around the world have been moving higher.
Outside of India and Taiwan, you won’t find a worse-performing country than America this year. We’re literally at the bottom of the leaderboard.
It’s almost crazy to think at this point… but after 15 years of US outperformance, could the rest of the world be taking the driver's seat?
First, let’s talk about the technical outlook. There is a growing list of individual countries that have already been outperforming the US. But, that’s not what we’re looking to find out. We want to know if it is finally time for ex-US equities, broadly speaking, to assume a leadership role.
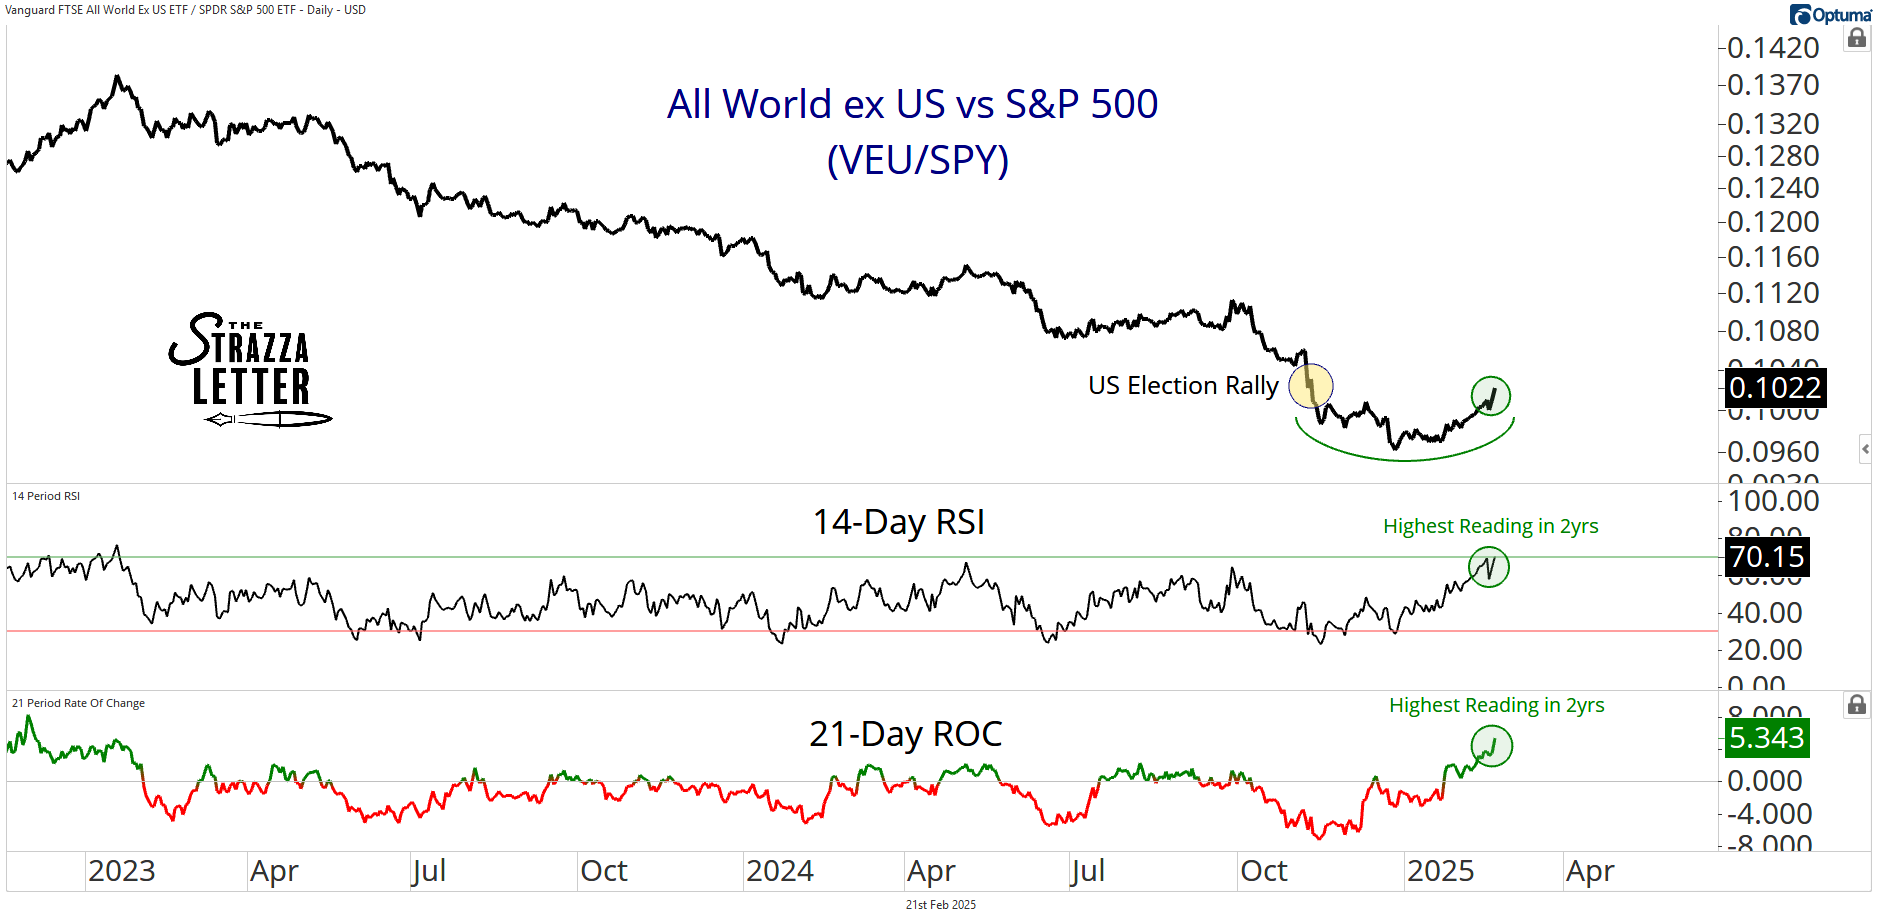
So, we must look at a cap-weighted diversified index to do this. Here’s a chart of the All Country World Ex-US Index relative to the S&P 500:
Some things to know about VEU’s composition is it is 40% Europe, 27% Emerging Markets, and 15% Japan. It’s a nice mix, and I think the fund offers solid information on global equities as a whole.
As you can see in the chart, some serious momentum is coming into this relationship on the side of international equities. Over the last two months, they have pared back all their post-election losses relative to US counterparts.
However, what you can’t see in the chart, is the VEU/SPY ratio has been in a steady secular downtrend for over 15 years.
But, that’s okay. New trends have to begin somewhere… and this is a great start.
Short-term momentum, measured by the 21-day rate of change, just hit its highest reading in over 2 years. The same can be said for RSI-14, which just registered its second overbought reading of the month. These things tend to happen in uptrends, not downtrends.
Another push over the next few weeks, and we could be talking about bullish initiation readings from these momentum indicators.
So the takeaway for me is two-fold:
There is still more work to be done and progress to be made by international stocks before we can say a valid reversal has taken place in the primary trend. We’re simply not there yet.
At the same time, we’re on our way. Momentum surges are common characteristics of bull markets, and these ratios aren’t far off from flashing some.
Now, consider the backdrop with which this is all taking place…
This is happening while the US is levying new or increasing tariffs all over the world.
It’s happening amid a backdrop of recency bias that has convinced investors US leadership and US tech dominance might never end.
It’s happening while valuations are depressed and sentiment is washed out for international stocks.
I pay extra close attention when the story and the price action dislocate in such an extreme fashion.
Right now, the headlines are telling us to run from international exposure, while the charts insist it’s time to be invested.
I’ll take the charts every time in this match.
We are putting out some fresh international equity trades next week in our Breakout Multiplier system.
We are already 8 out of 8 on our China trades with multiple 10x winners.