Momentum thrusts come in two forms… initiation and exhaustion.
The former signals the beginning of a new trend, and the latter marks the end of an existing one.
For this reason, it’s very important to identify what kind of thrust we’re dealing with. You don’t want to get that part wrong. Luckily, we have tools for this, and it’s not hard.
Anyway, I’m talking about international equities. I think the backdrop is set up perfectly for a big seed change in favor of ex-US stocks.
We talked about it on the blog a few weeks ago, and it’s happening in a big way as we speak.
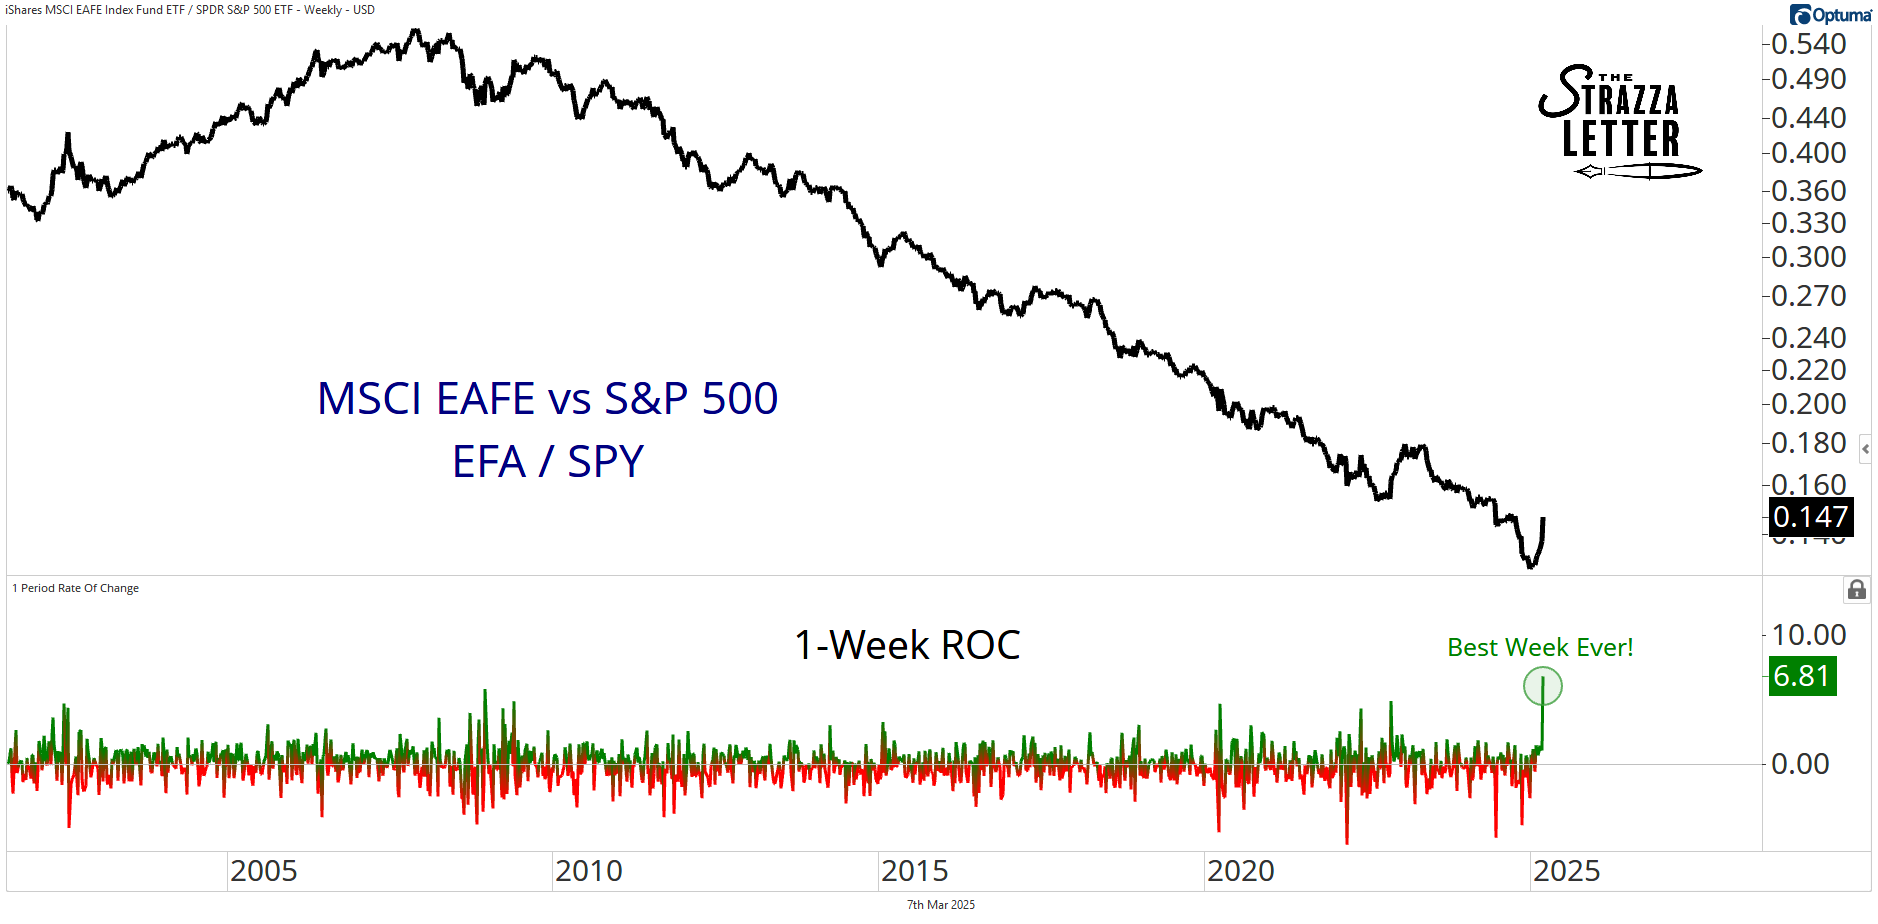
Global equity markets just posted their best week in history relative to the US equity market.
Here’s the MSCI EAFE $EFA vs S&P 500 $SPY relative ratio with the 1-week rate of change shown in the lower pane:
And EFA is not alone in this. Many of the most important diversified international indexes look this way right now.
The All World Index Ex-US $VEU and Euro STOXX 50 $FEZ also had their best relative performances since ETF inception this week.
The MSCI Germany and MSCI France ETFs did as well. This was the biggest rotation week in almost 30 years of market history for these countries.
So, what do all these extreme momentum readings tell us?
And how do we know if it is initiation or exhaustion?
The way we know is by looking at the trend and price action. And in this instance, it couldn’t be easier.
It simply cannot be an exhaustion reading for these ratios because there is nothing to exhaust.
The relative trends for all these international indexes have been pointing lower for 10-15 years now. These have been strong and steady secular downtrends.
The fact there is no uptrend in place to exhaust means these are initiation readings.
But just how good will this signal end up being?
It means nothing to me if international stocks are showing relative strength but falling on absolute terms. I don’t want to buy things just because they are going down less than their alternatives. I want to buy things that are going up and outperforming their alternatives as they do.
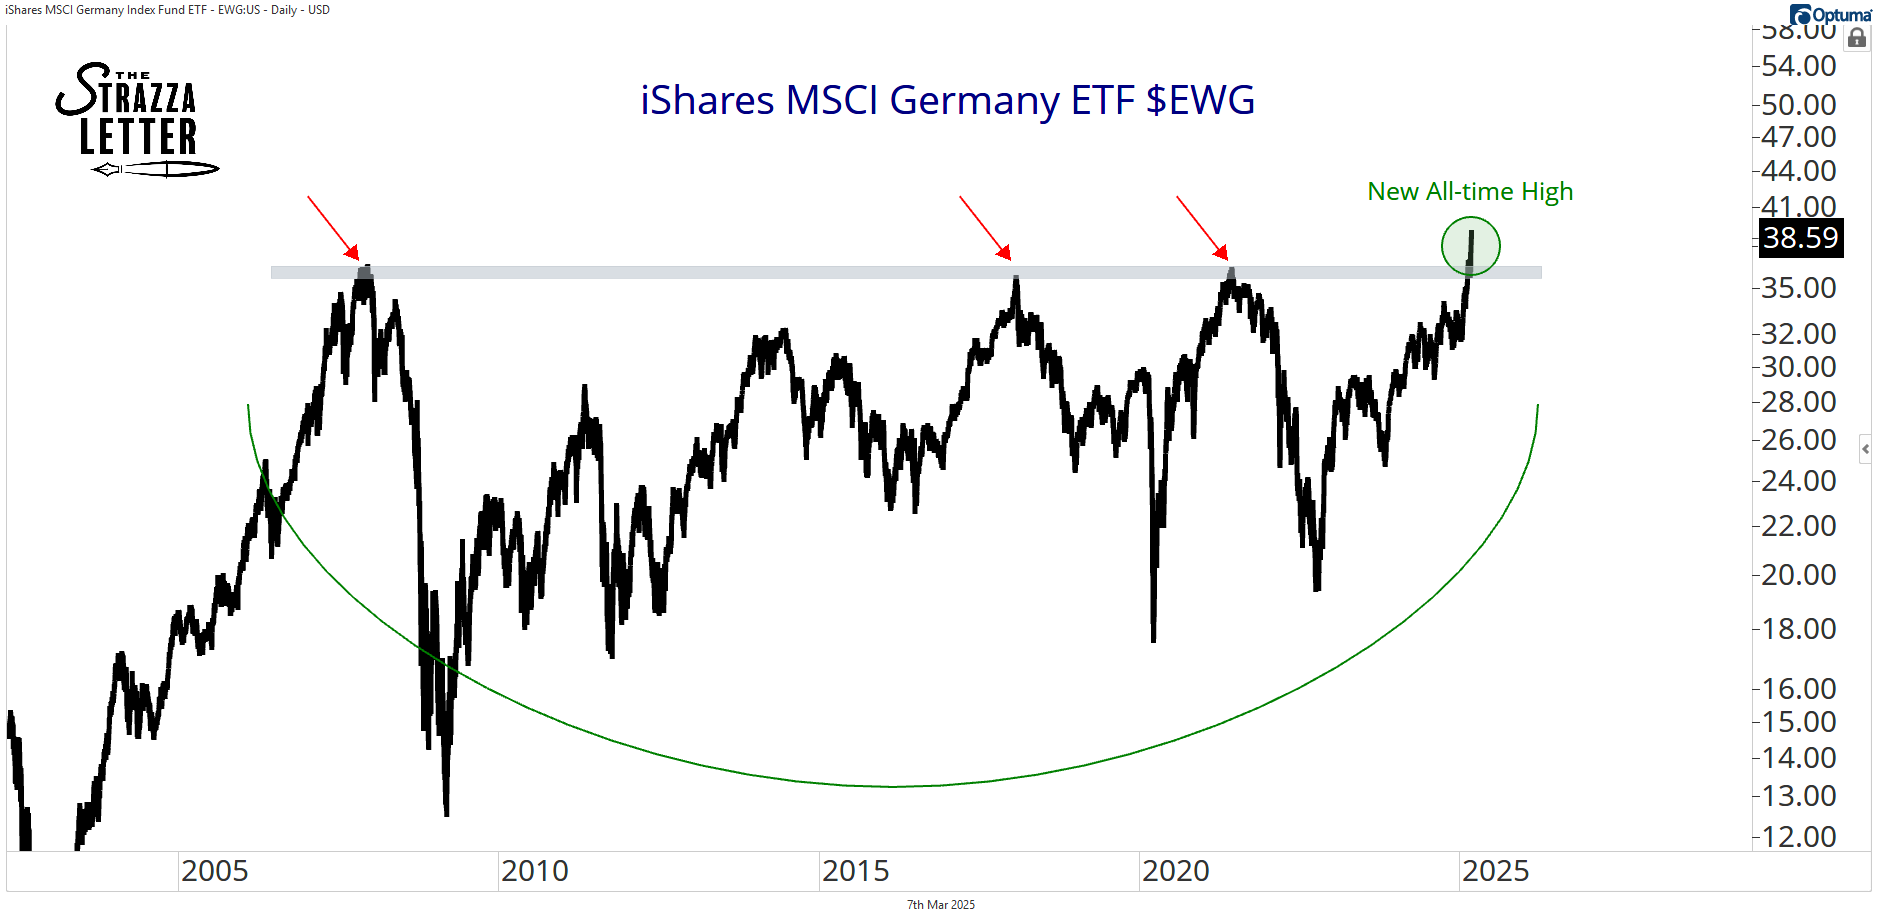
This brings me to my next chart…
This is what all the absolute price charts look like in the indexes that just registered initiation thrusts vs the S&P 500.
They either just broke out of - or are close to breaking out of massive bases that date back to the great financial crisis.
These are literally some of the most bullish long-term chart structures in the market right now.
If these are valid base breakouts, not only will there be positive alpha in ex-US stocks, but there will be big gains as well.
The last time we were talking about “best week ever” on a relative basis was with China back in October.
In the time since that thrust, Chinese stocks pulled back hard in Q4 but have since gone on to make new cycle highs and complete trend reversals on both absolute and relative terms.
This brings me to my last point. It’s so important to understand exactly what the momentum thrust signal means.
It is similar to a breadth thrust in the sense that it gives me the highest degree of confidence that a new long-term uptrend is underway.
However, it also means things are probably a bit overheated in the short term.
Chinese stocks corrected for three months from October to January before recently surging higher.
You really had to trust the thrust to buy that dip.
I think ex-US stocks and, namely, Europe, are in the same boat now. If the global indexes stick these base breakouts, I’m expecting big gains and long-term leadership from international equities in the future.