Sellers have dominated the tape for the past several weeks.
Any bid for stocks since we rolled over in February has been weak and short-lived.
At the same time, we are more than due for a serious bounce.
Some sentiment metrics are at wash-out levels.
Put volume is at record highs.
US stock indexes are deeply oversold.
In the case of Nasdaq 100 futures, this is worse than the pandemic lows from 2020.
But oversold can always get more oversold.
And when it comes to sentiment data, there is simply no signal without confirmation from price.
So, I just gotta see it at this point.
A rebound rally is surely coming, but how much selling will happen first? And how good will it be?
There definitely won’t be a meaningful bounce until we string together some consecutive up days. We haven’t seen back-to-back green candles in the S&P since its peak in February.
Literally, zero bullish follow-through in almost a month. That needs to change for markets to make a tradable low.
And at this point, when it happens, it better be good.
Both the short and long-term trends have suffered serious damage that now needs repairing.
Here are a few ways I plan to measure the quality of the bounce when it finally comes.
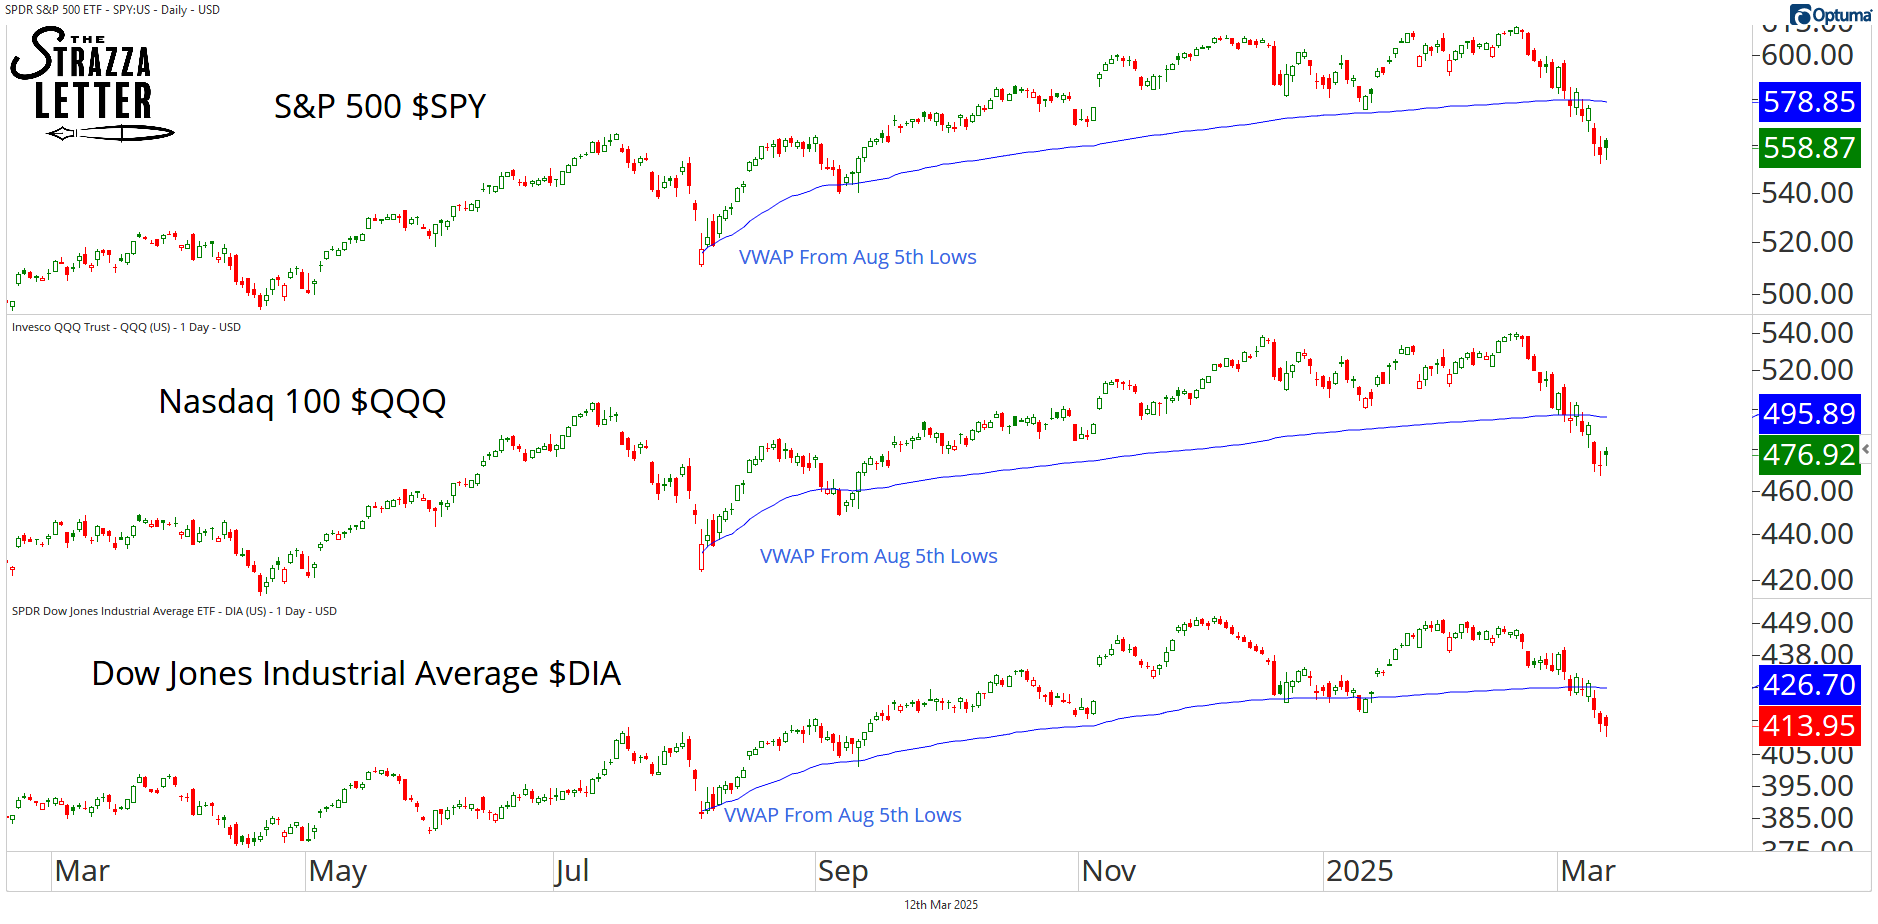
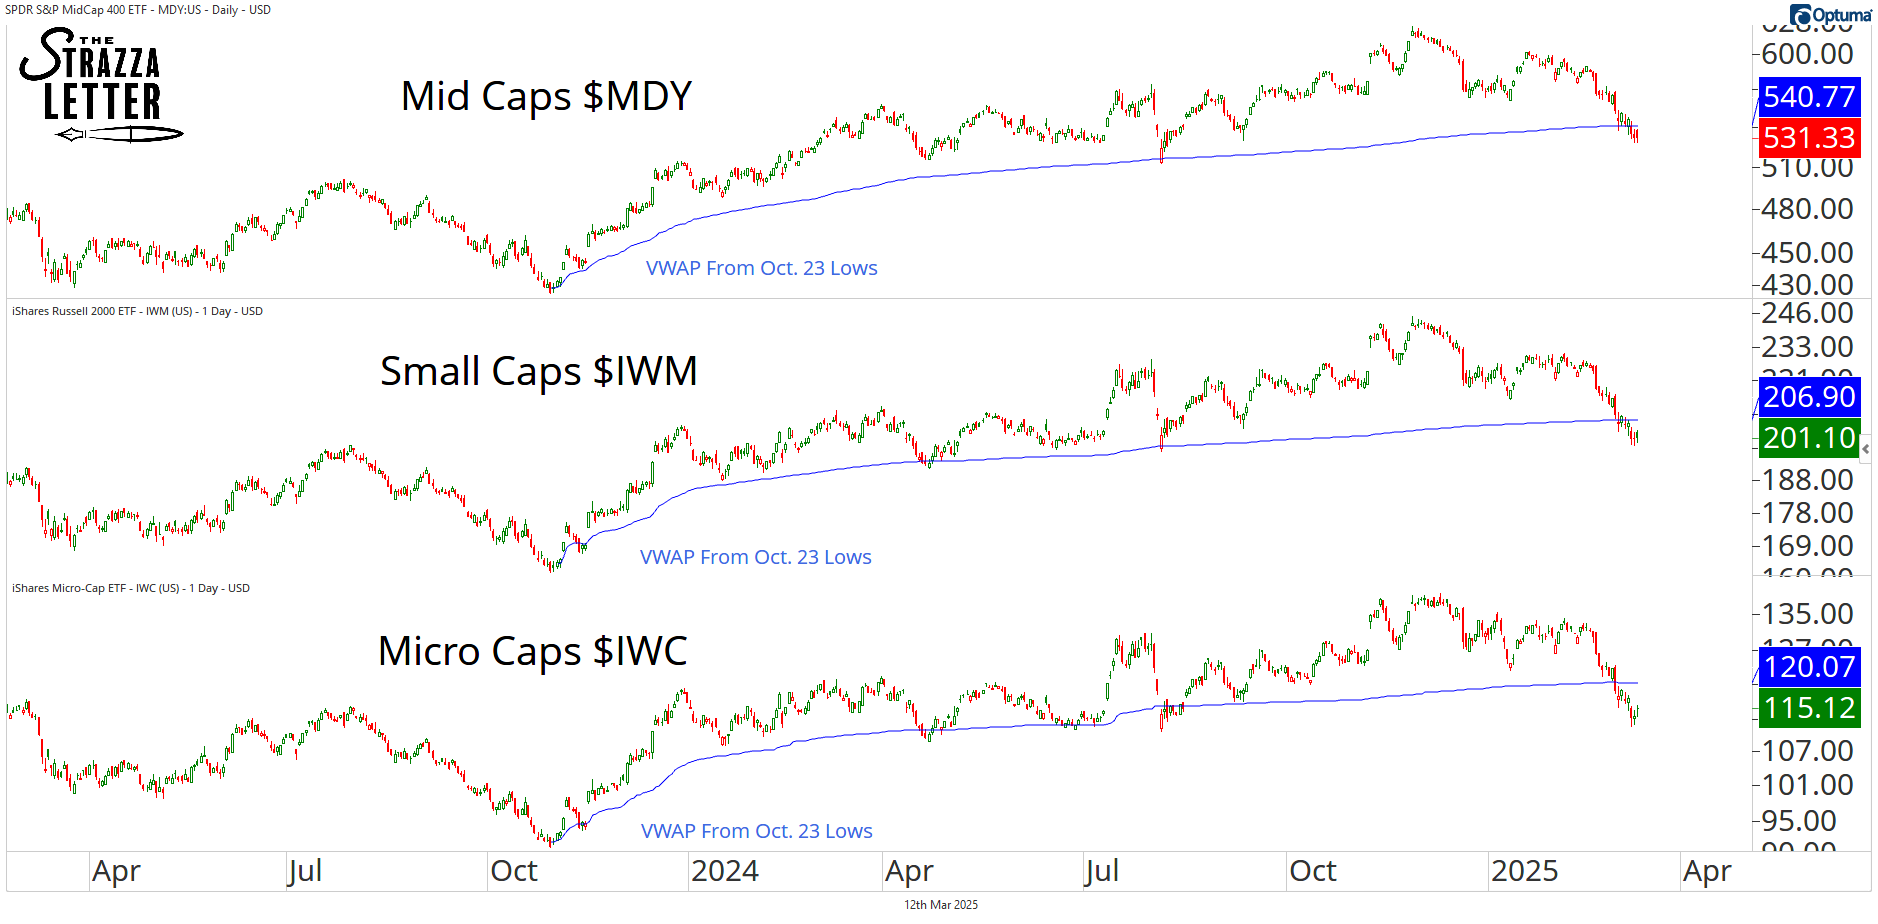
I’ll also be judging SMIDs based on whether or not they can bounce back above their key VWAP levels.
For the S&P 400, Russell 2000, and Russell Microcaps, we’re anchoring from the Q4 2023 lows.
Just look how many times these were tested successfully before recently breaking.
So, when the bounce comes… I’m asking:
Did these charts get back to those VWAPs?
Did they overshoot and reclaim them?
And then when the bounce ends… Are they now holding them as support?
The answers to those questions will provide valuable information about the market’s next step.
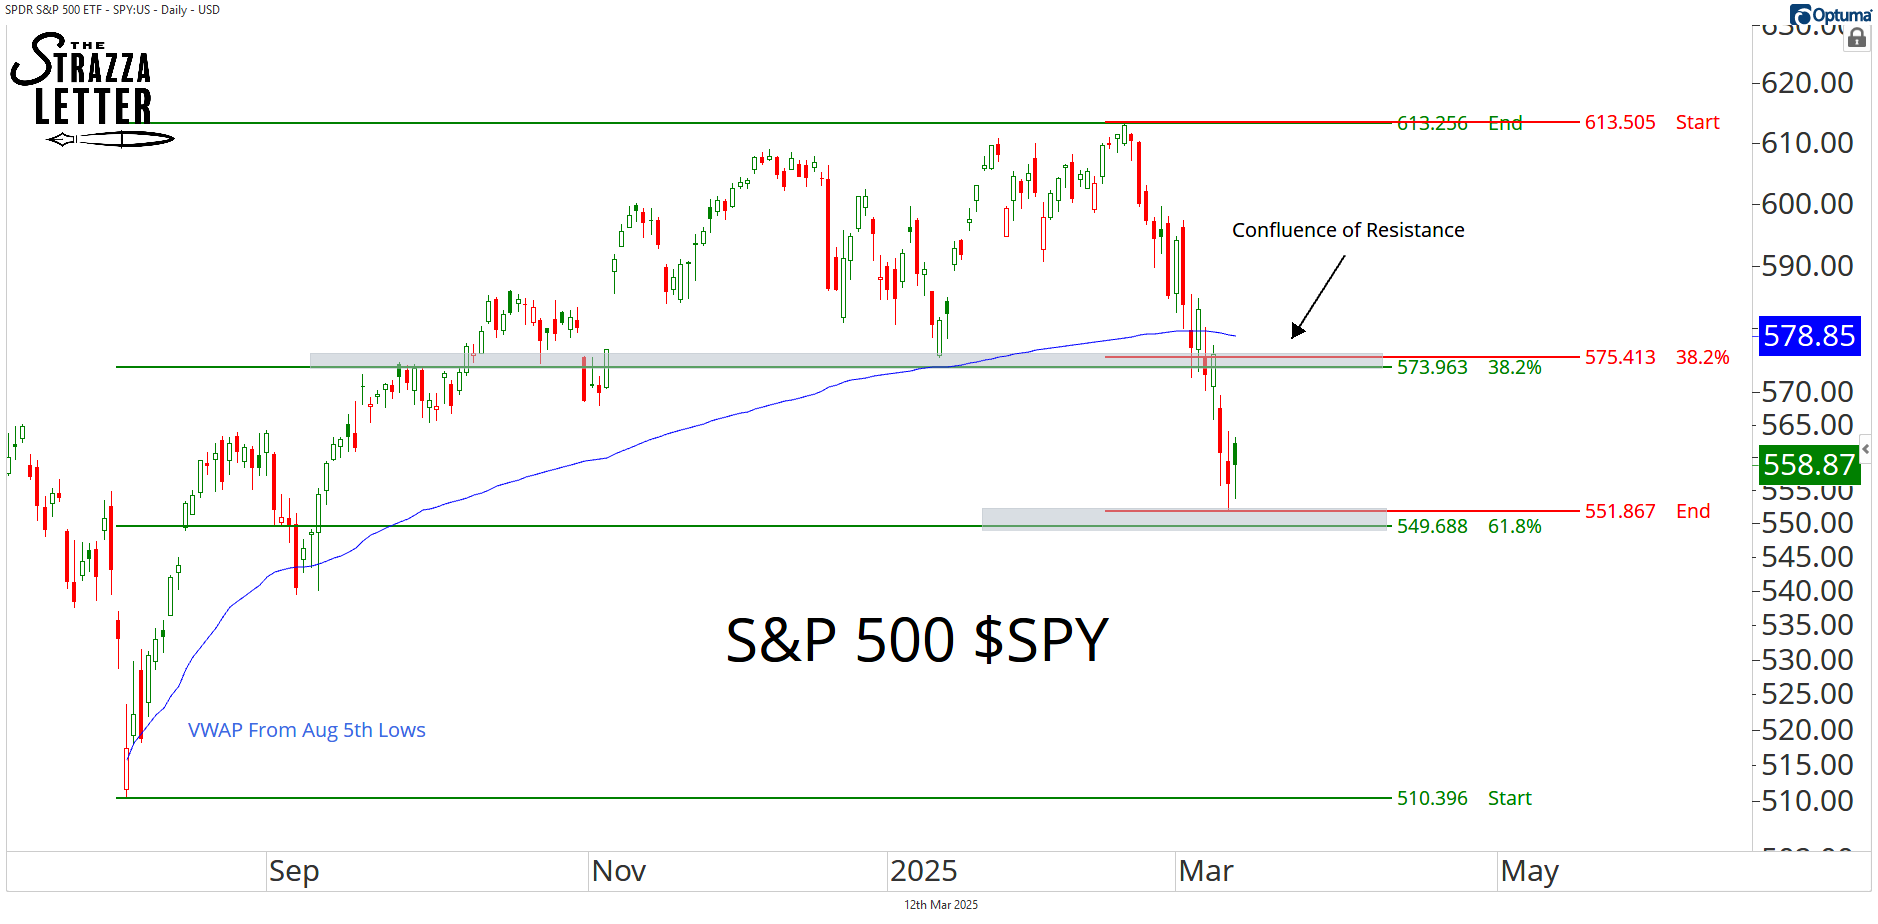
Here’s one more way to judge a bounce… Fib it out and see how much damage is repaired by it. Personally, I want to see at least 38% of the down leg retraced. Anything less will suggest sellers are still in control.
Here’s what that would look like in the S&P 500:
Interestingly enough, because we retraced almost exactly 62% of the August low advance, a 38% retracement of the current correction will get us right back to the 38% Fib from the other direction. It’s just Fibonacci math.
But more importantly, it speaks to a confluence of interest back at this 575 level in SPY. It also coincides with the August low VWAP and the January pivot low.
I think it’s really important we get back there. And the faster the better.
If not, sellers are likely to remain in control. If that’s the case, I’ll be a lot more interested in fading rips than buying dips.
We should learn a lot on this rally attempt. Stocks need to prove themselves here and repair some damage.
I hope to see it.
Scratch that.
At this point, I gotta see it.
Steve
P.S. Regardless of what happens to the US equity market from here, we plan to keep trading whatever is trending in our Breakout Multiplier system. We can do different things in different environments, and we do!
For example, despite the down market, we just booked a 10-trade win streak leaning on international equities and uncorrelated trades.