I’ve made plenty of mentions to our Bear Market Checklist in recent weeks.
It’s something we’re always keeping track of, but matters more in some times, and less in others.
When we’re in rally mode, it barely crosses my mind. But when volatility strikes, and markets are selling off, it’s the most valuable thing I have.
Let’s break down exactly what it is and how we use it to guide our analysis at All Star Charts.
As we track the progress of a bull market, we have major indexes and assets that we want to see achieve certain milestones. This is also true for risk appetite ratios, credit spreads, and breadth indicators.
So, we simply make a list of these charts and key levels along the way.
When corrective waves occur, we look for these levels - which in many cases, represent a big line in the sand for these trends, to remain intact.
We keep tabs of what holds and what doesn’t, and we weigh the evidence accordingly.
When too many of these zones are violated, it can spell the end of the bull market… and the beginning of a new bear.
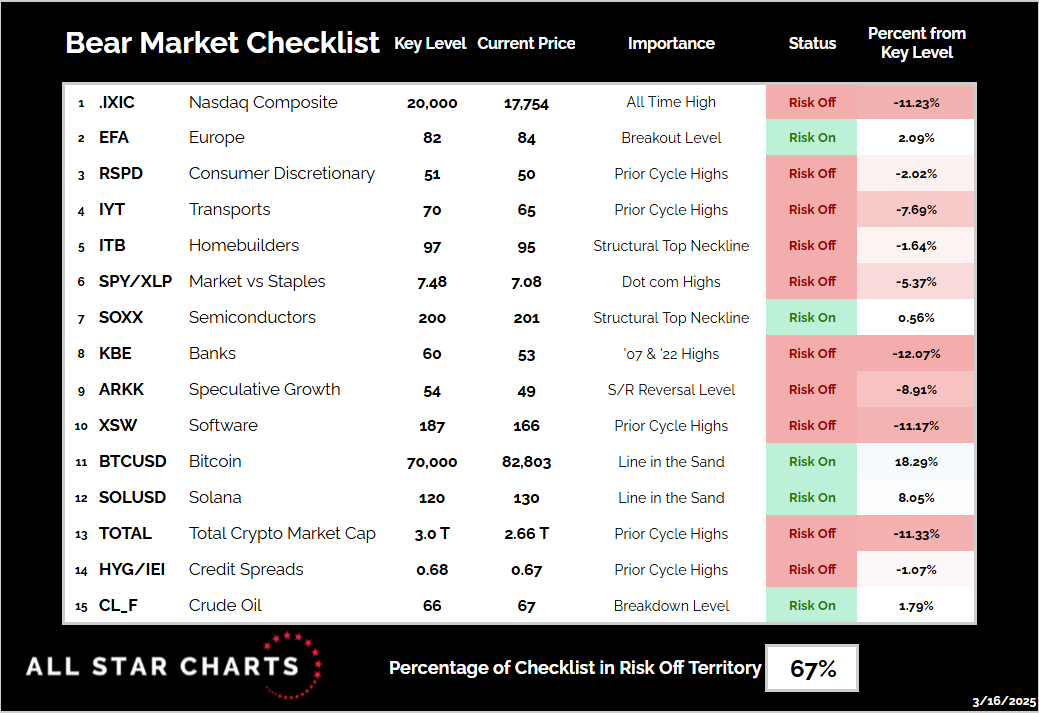
Hence the name Bear Market Checklist. Here it is:
*We low-balled the BTC level, I know. Don’t ask me about it.*
The reason I keep talking about the checklist is because it’s seen a lot of action during this sell-off.
Some monster levels that have been giving us the green light since early last year are breaking. And they are not just breaking, they are getting smashed.
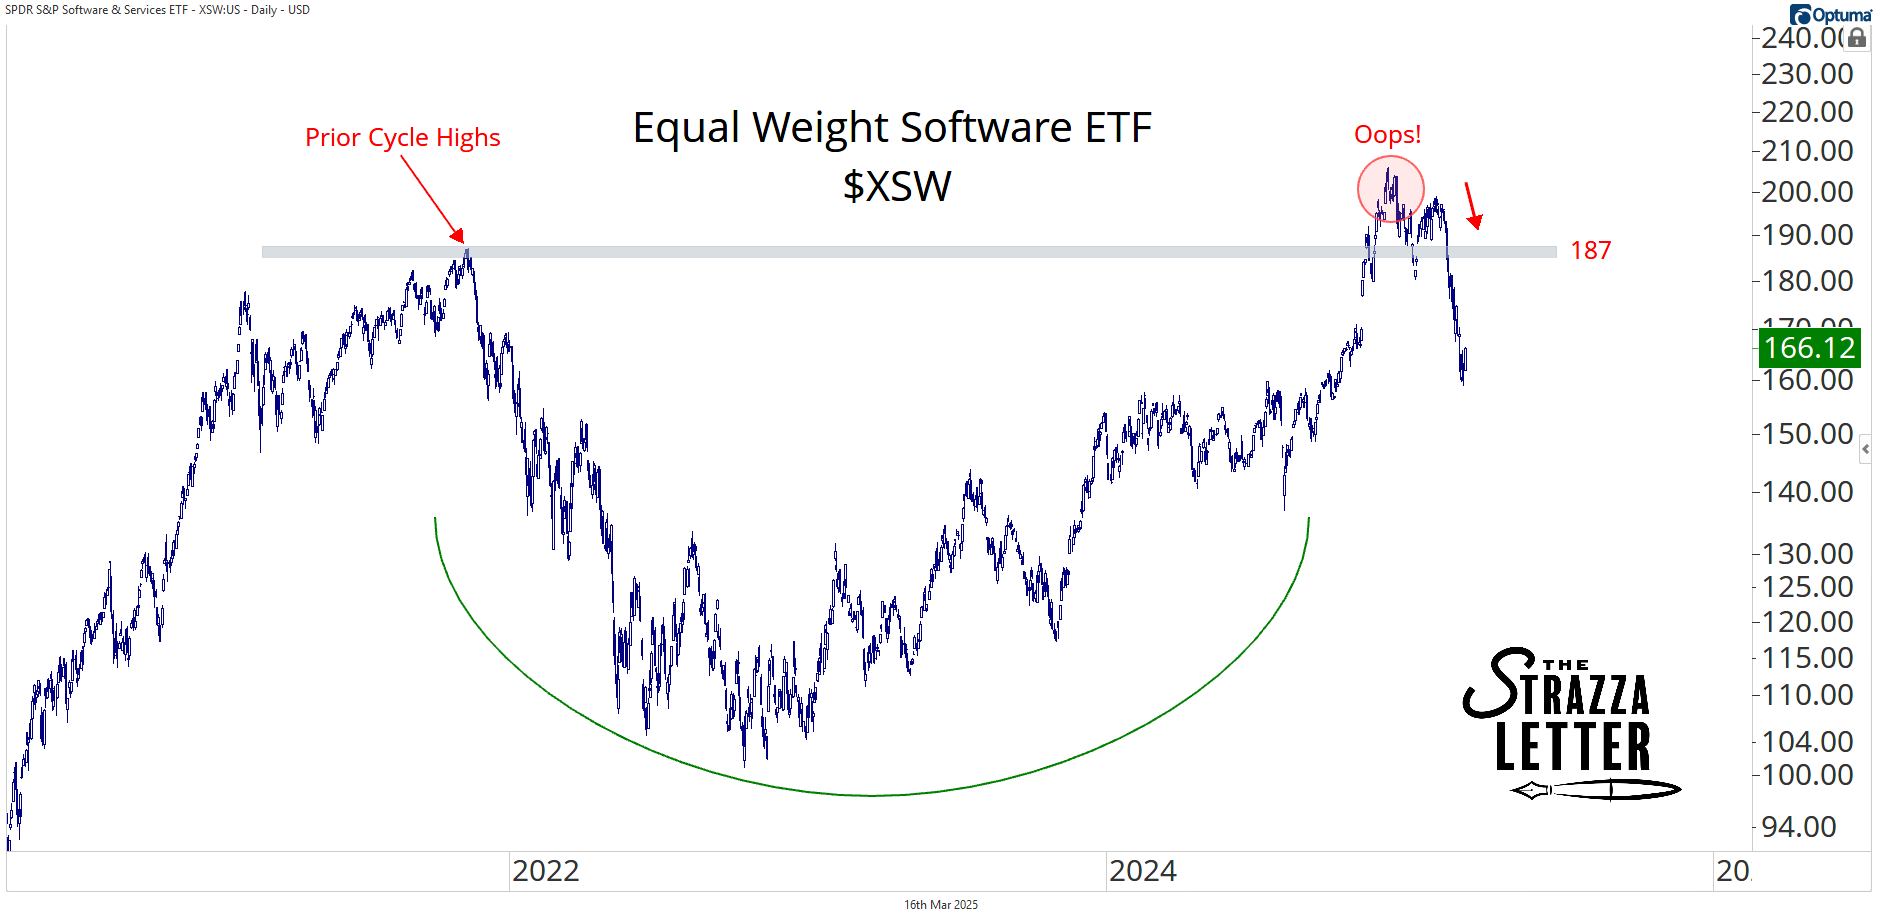
The way they resolve and react at these inflection points matters. Take equal weight software, for instance.
XSW broke out above its prior cycle highs late last year. However, the recent selling pressure plunged it back through this critical zone as if nothing ever happened there.
Now it has a ways to go to reclaim 187. It closed at 166 on Friday.
And that’s the story for most of the items on our Bear Market Checklist right now. There’s a lot of work for bulls to do.
We know a big bounce is coming for US equities.
But how much damage will be repaired during it?
That’s what I’m paying attention to in the coming days and weeks.
How good is the rebound? Is it good enough for XSW to get back above those old highs?
That would be a big bullish data point.
And how about the other checklist items? How many key levels are reclaimed?
Not long ago this list was at 0% bearish. Everything was above its risk level. Today it is at 67%. And if anything, our support levels are generous.
I can’t wait to see what changes when risk assets finally rebound. Bulls are hoping a lot of these items flip bullish.
That’s another way I plan to judge the coming rally. I’ll let you know how we make out and be sure to share an updated list again soon.